HP Storage Mirroring Software User Manual
Page 59
57 of 118
3. In the Background Color field, select a default color for the background of the
chart area.
4. In the Grid Color field, select a color to be used for chart grids.
Note: This applies only to charts with grids.
5. In the Horizontal Grid Visibility field, select whether to show or hide the horizontal
gridlines.
6. In the Vertical Grid Visibility field, select whether to show or hide the vertical
gridlines.
7. In the Plot Area Fill Type, select whether the fill in the plot area should be solid or
gradient.
8. In the Plot Area Color 1 and 2 fields, select the color(s) to be used for the plot
area fill.If you selected Solid fill type, select only Plot Area Color 1. If you selected
Gradient, Plot Area Color 2 will determine the second color used in the gradient. In
case of 3D chart, this color will be applied to the walls of the cube containing the
3D chart.
9. In the Axis Color field, select a color for the axis and axis text.
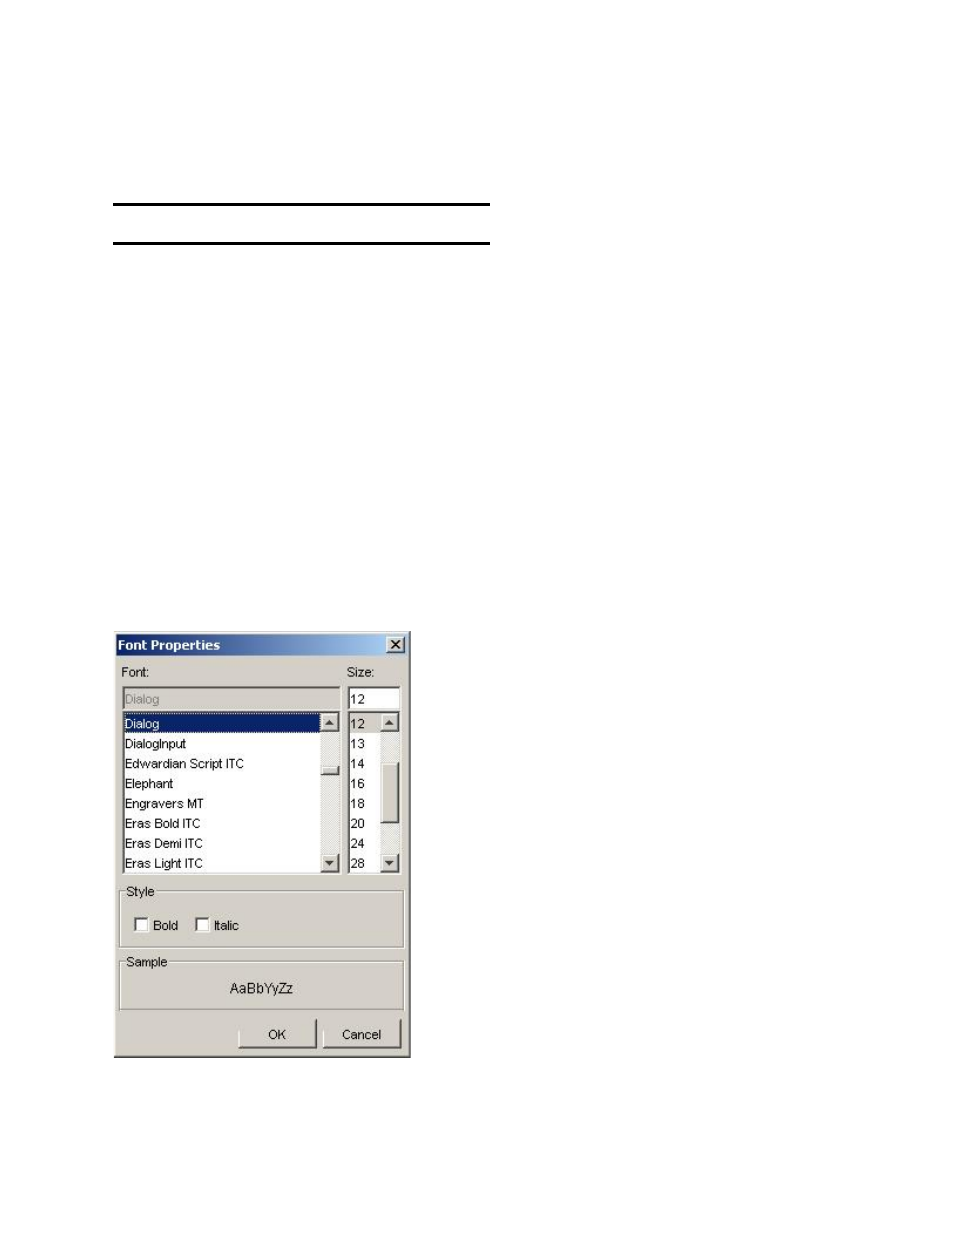
10. To specify a font for the axis label text, clear the User Selected checkbox, then
click the Font button. The Font Properties dialog box appears.
- StorageWorks MSL6000 Tape Library (61 pages)
- Лент-е накопители HP StoreEver DAT (64 pages)
- Лент-е накопители HP StoreEver DAT (50 pages)
- StoreEver Ultrium Tape Drives (60 pages)
- Linear Tape File System Software (28 pages)
- Linear Tape File System Software (25 pages)
- StoreEver Ultrium Tape Drives (78 pages)
- StoreEver Ultrium Tape Drives (76 pages)
- Linear Tape File System Software (20 pages)
- StoreEver Ultrium Tape Drives (61 pages)
- StoreEver TapeAssure Software (40 pages)
- StoreEver Ultrium Tape Drives (75 pages)
- 2600fx Optical Disk Drive (65 pages)
- Ленточный автозагрузчик HP StorageWorks DAT 72x10 (58 pages)
- 2000fc Modular Smart Array (150 pages)
- StorageWorks 1000 Modular Smart Array (72 pages)
- StorageWorks 1000 Modular Smart Array (81 pages)
- StorageWorks 1500cs Modular Smart Array (48 pages)
- StorageWorks 1500cs Modular Smart Array (52 pages)
- StorageWorks 1500cs Modular Smart Array (71 pages)
- Servidor de almacenamiento HP ProLiant DL585 G2 (152 pages)
- Sistemas de almacenamiento de red HP StorageWorks X3000 (152 pages)
- Software de HP StoreVirtual VSA (85 pages)
- Software de HP StoreVirtual VSA (127 pages)
- X500 Data Vault (331 pages)
- StorageWorks 1000i Virtual Library System (122 pages)
- 200 Storage Virtualization System (176 pages)
- XP Array Manager Software (101 pages)
- StorageWorks XP Remote Web Console Software (20 pages)
- StorageWorks MSA 2.8 SAN Switch (22 pages)
- StorageWorks MSA 2.8 SAN Switch (104 pages)
- StorageWorks MSA 2.8 SAN Switch (270 pages)
- StorageWorks MSA 2.8 SAN Switch (307 pages)
- StorageWorks All-in-One SB600c Storage Blade (72 pages)
- StorageWorks All-in-One SB600c Storage Blade (80 pages)
- StorageWorks All-in-One SB600c Storage Blade (78 pages)
- StorageWorks All-in-One SB600c Storage Blade (60 pages)
- ProLiant DL585 G2 Storage-Server (150 pages)
- Data Protector Express Basic-Software (83 pages)
- Data Protector Express Basic-Software (93 pages)
- ProLiant DL185 G5 Storage Server (174 pages)
- ProLiant High Availability Storage Server (72 pages)
- 2000I G2-Modular-Smart-Array (48 pages)
- P2000 G3 MSA Array Systems (58 pages)
- StorageWorks 2000fc G2 Modular Smart Array (76 pages)