Jenway 7315 Manual Italian User Manual
Page 50
50
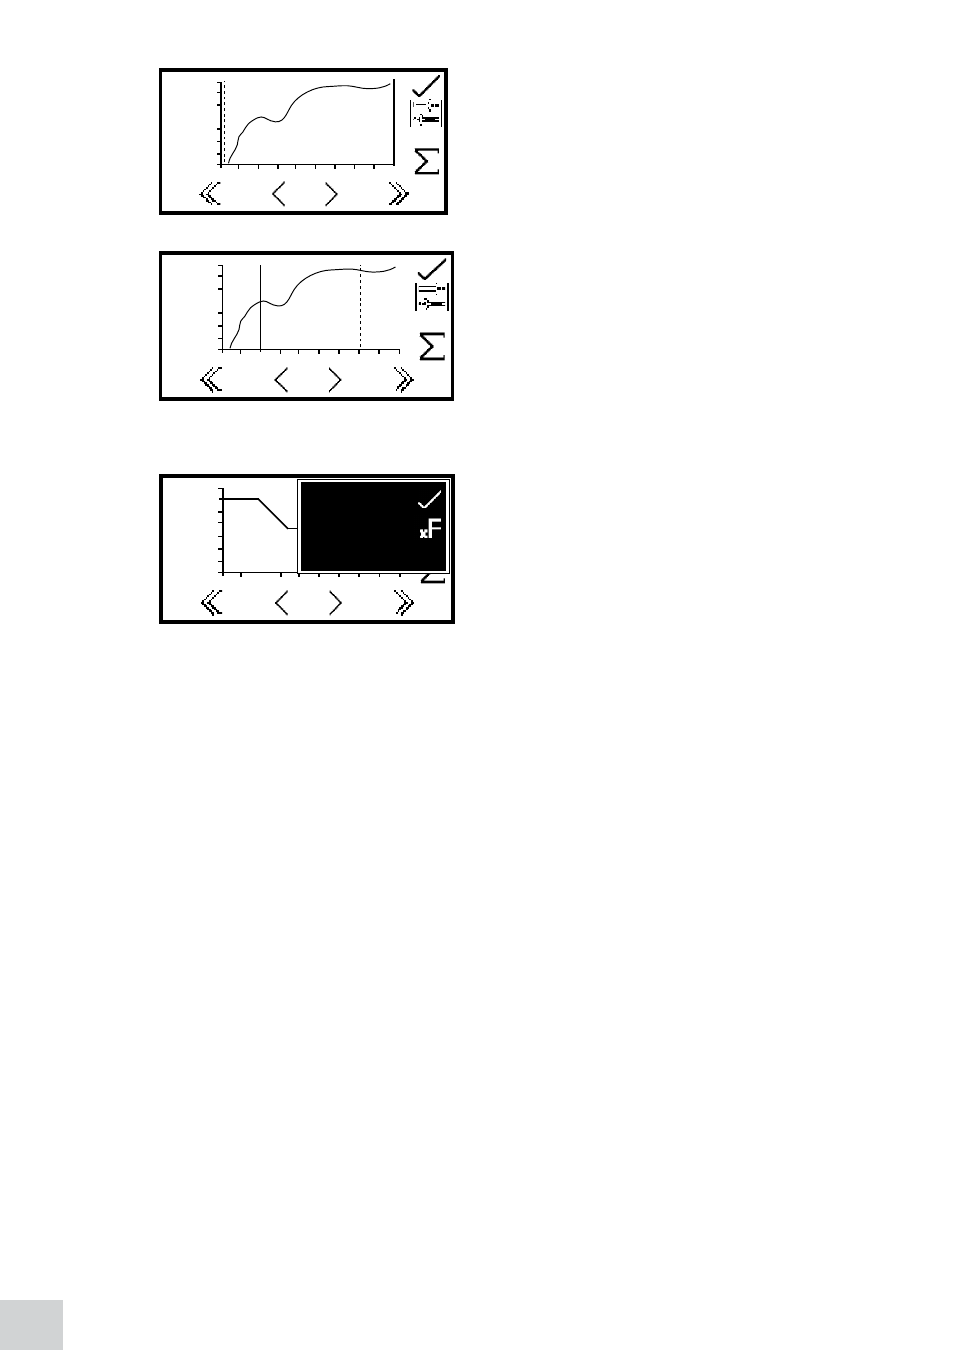
In the kinetics moving line screen the initial and final
time lines appear as two vertical lines. The line which is
selected is represented by a dashed line ---- and can be
moved using the keys below the
greater than (>) or less
than (<) icons at the bottom of the screen. Move the
dashed line to the point on the x-axis which is to be the
initial time.
To select the final time press the key adjacent to the
toggle icon. This will change the initial line from a
dashed line to a solid line. The final time line will change
from a solid line to a dashed line. Use the keys below the
greater than (>) or less than (<) icons to move the line
to the final time on the x-axis by reducing or increasing in
1 second time intervals.
The
double greater than (>>) or double less than (<<)
icons move the line in 5 second time intervals.
Once the required initial and final times have been
selected press the key adjacent to the
S
icon to display
the statics menu for that portion of the experiment. The
information displayed includes concentration, absorbance
per minute (rate of change), correlation coefficient (r
2
),
start time absorbance and end time absorbance. If the
operating mode selected was % transmittance then the
statistics will be % transmittance instead of absorbance.
To exit the statistics menu press the key adjacent to the
tick icon.
3.000
ABS
-5.000
0.00
10.00
5.0
s
ppm
0.000
1.000
0.152
0.152
3.000
ABS
-5.000
0.00
10.00
5.0
s
ppm
0.000
1.000
0.152
0.152
3.000
ABS
-5.000
0.00
10.00
5.0
s
ppm
0.000
1.000
0.152
0.152
-0.005
ABS/m:
r2:
0s
10s
ppm
-0.005
0.74
0.118
0.112