PASCO ME-9833 Physical Pendulum Set User Manual
Page 13
Physical Pendulum Set
Model No. ME-9833
13
®
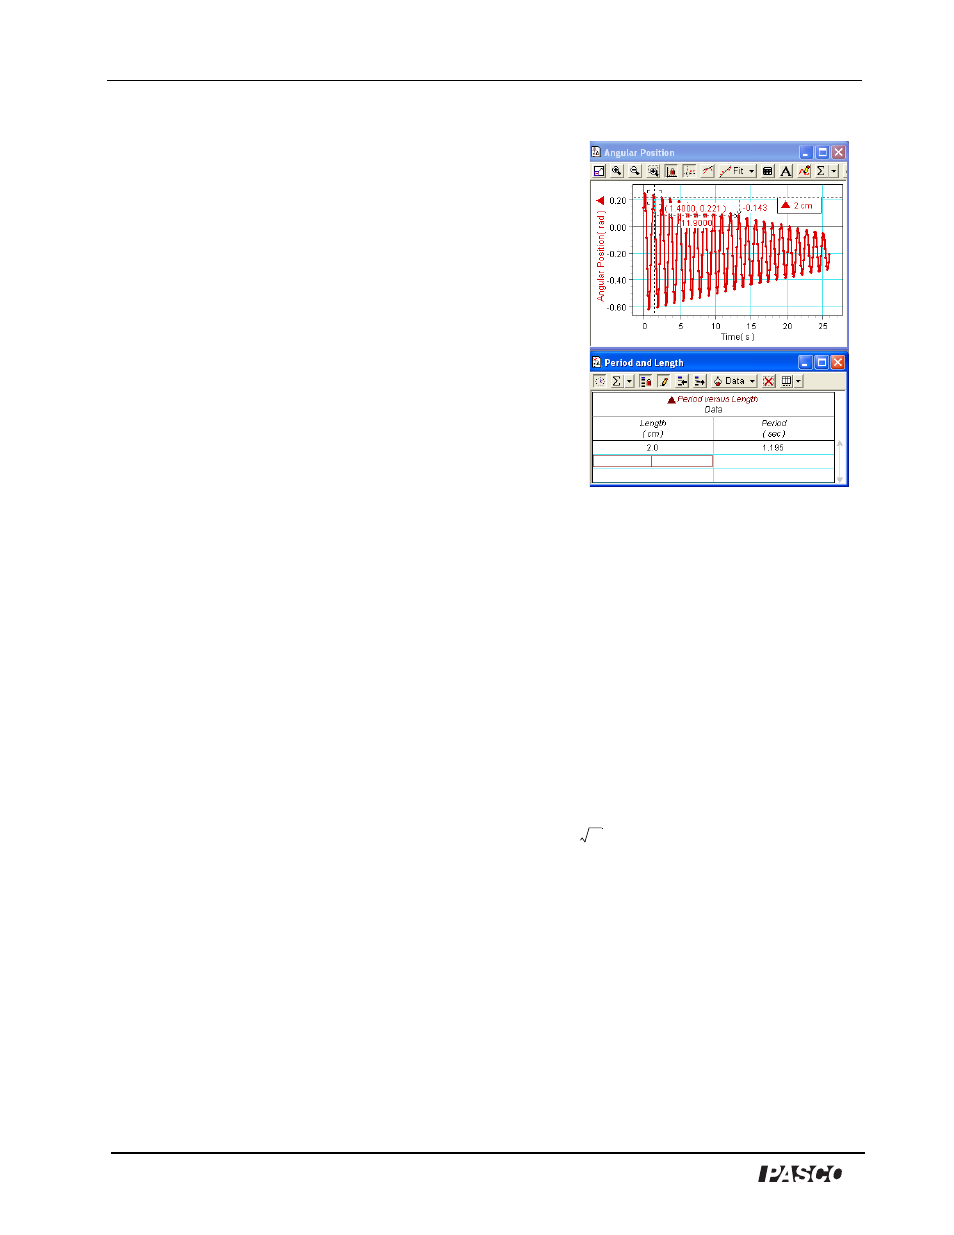
2. Double click the label of the new Table display in
the Summary panel to open the Data Properties
window. Give the table a Measurement Name of
‘Period versus Length’, an ‘X’ Variable Name of
‘Length’ with ‘cm’ for units, and a ‘Y’ Variable
Name of ‘Period’ with ‘s’ for units.
3. Find the period of oscillation for the ‘2 cm’ setup.
(a) Click the ‘Smart Cursor’ button in the toolbar.
(b) Move the Smart Cursor to one of the first peaks
of Angular Position.
(c) Hover the cursor over the Smart Cursor until the
‘delta’ symbol appears.
(d) Click and drag the ‘delta’ symbol to the tenth
peak of Angular Position.
(e) Divide the time for ten oscillations by ten and
record the number as the period of oscillation.
4. In the Table display, enter ‘2’ as the first length in
the ‘x’ column and the period of oscillation for the 2 cm length as the first period in the ‘y’
column. Continue to enter data points in the Table display.
5. Click and drag a Graph display icon from the ‘Displays’ part of the Summary panel to the
‘Data’ under ‘Period versus Length’ in the top part of the Summary panel. The Graph
display opens with ‘Period’ on the Y-axis and ‘Length’ on the X-axis.
6. Determine which length gives the minimum period of oscillation of the pendulum bar and
record this length in the data section.
Data Section
Length of pendulum bar, L: _________________
Calculated value for length that gives minimum period (
): _________________
Measured value for length that gives minimum period: __________________
Percent difference: ___________________
Questions
1. What is the percent difference between the calculated value for the length that gives
minimum period of oscillation and the measured value for the length?
2. Would a pendulum bar with different mass but with the same dimensions have a different
value for the length that gives minimum period of oscillation? Why or why not?
L
cg
1
12
----------L
=
Figure 2-3: Typical data