An allrounder, Test signals – as you like it – Atec Rohde-Schwarz-UPL User Manual
Page 4
4
Audio Analyzer UPL
An allrounder
Test signals – as you like it
The generators of UPL supply an
extremely wide variety of analog and –
with options UPL-B2 or UPL-B29 –
digital test signals:
• Sinewaves
for level and harmonic distortion
measurements. The signal can be
applied to an equalizer with user-
selectable nominal frequency re-
sponse, eg for compensating the
frequency response of the test as-
sembly
• Two-tone signal
for modulation distortion analysis.
Various amplitude ratios can be se-
lected and the frequencies are con-
tinuously adjustable
• Difference tone signal
for intermodulation measurements
with continuous setting of both fre-
quencies
• Multitone signal
comprising up to 17 sinewaves of
any frequency and with the same
or different amplitude; setting the
phase is also possible with UPL-B6
• Sine burst signal
with adjustable interval and on-
time as well as programmable low
level, eg for testing AGCs
• Sine
2
burst
also with adjustable interval and
on-time, eg for testing rms rectifier
circuits
• Special multitone signal
comprising up to 7400 frequencies
with selectable amplitude distribu-
tion. The frequency spacing can be
linked to the resolution used for the
fast Fourier transform, thus en-
abling rapid and precise single-
shot measurements of the frequen-
cy response of a DUT
• Noise
with a variety of probability distri-
butions, eg for acoustic measure-
ments; setting of crest factor with
UPL-B6
• Arbitrary waveforms
for generating any voltage curve
of up to 16k points. Test signals
can be output in different file for-
mats, eg voice and music signals
stored as WAV files
• Two-channel sinewave signals
for the two digital output channels
when UPL-B6 is used
• AM and FM
for sinewave signals
• DC
also with sweep function
Signals can be generated with an
offset. Moreover, digital audio signals
can be dithered with adjustable level
and selectable amplitude distribution.
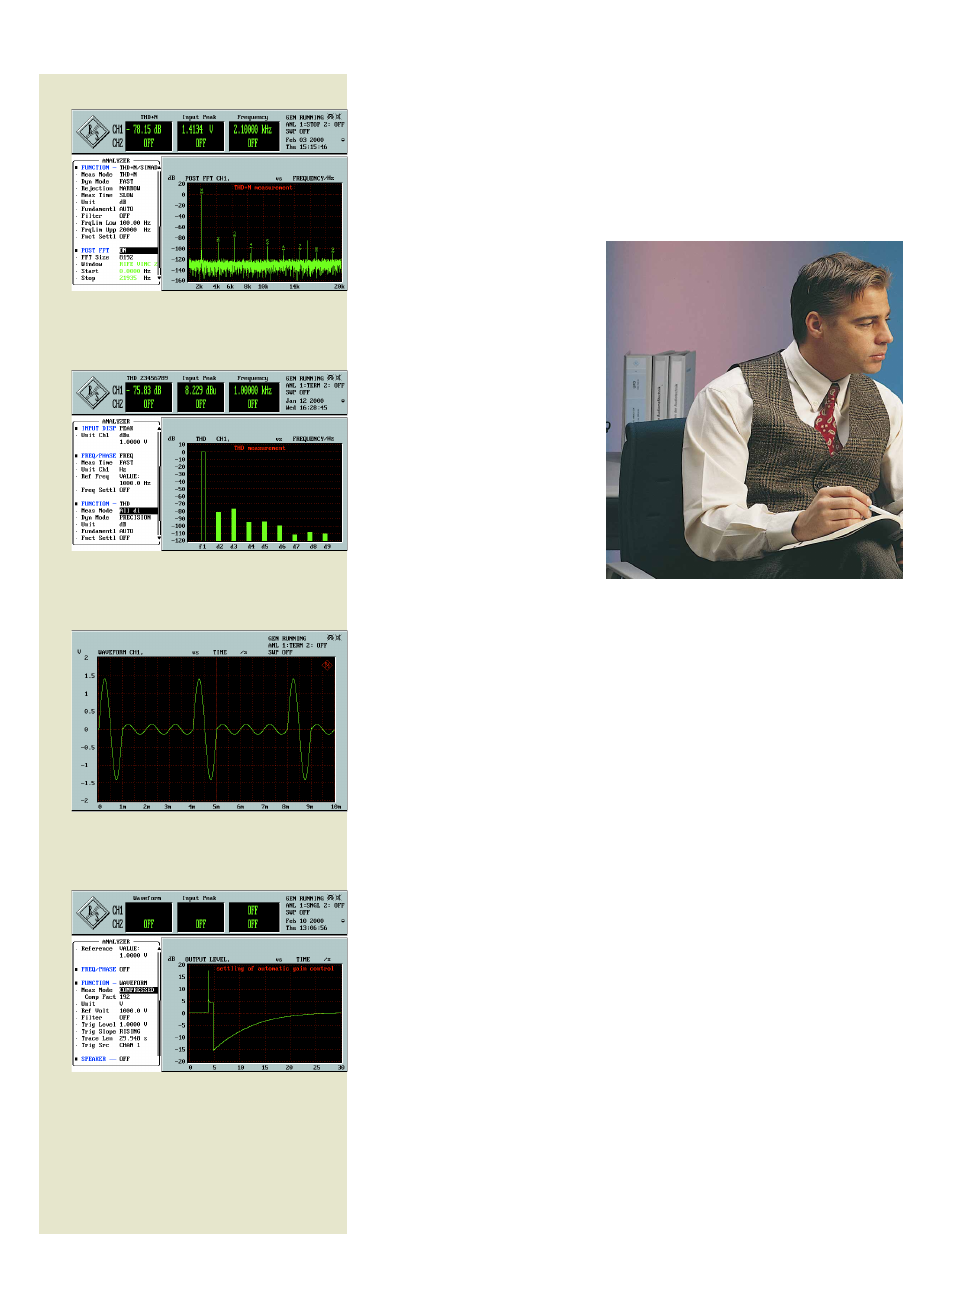
Fig. 1: Automatic marking of harmonics in THD+N measure-
ments makes nonharmonics visible at a glance
Fig. 2: In THD measurements, single harmonics, all harmonics
or any combination of harmonics can be measured
Fig. 3: The waveform function displays the test signal in the
time domain. The example shows a sinewave burst
Fig. 4: The transient characteristics of an AGC play an impor-
tant role in testing hearing aids or automatic volume control on
tape recorders