Characteristic curves – GE Industrial Solutions JNC350R Series User Manual
Page 5
Data Sheet
August 9, 2010
JNC350R Power Modules; DC-DC Converters
18 – 36 Vdc Input; 28Vdc Output; 350W Output
LINEAGE
POWER
5
Characteristic Curves
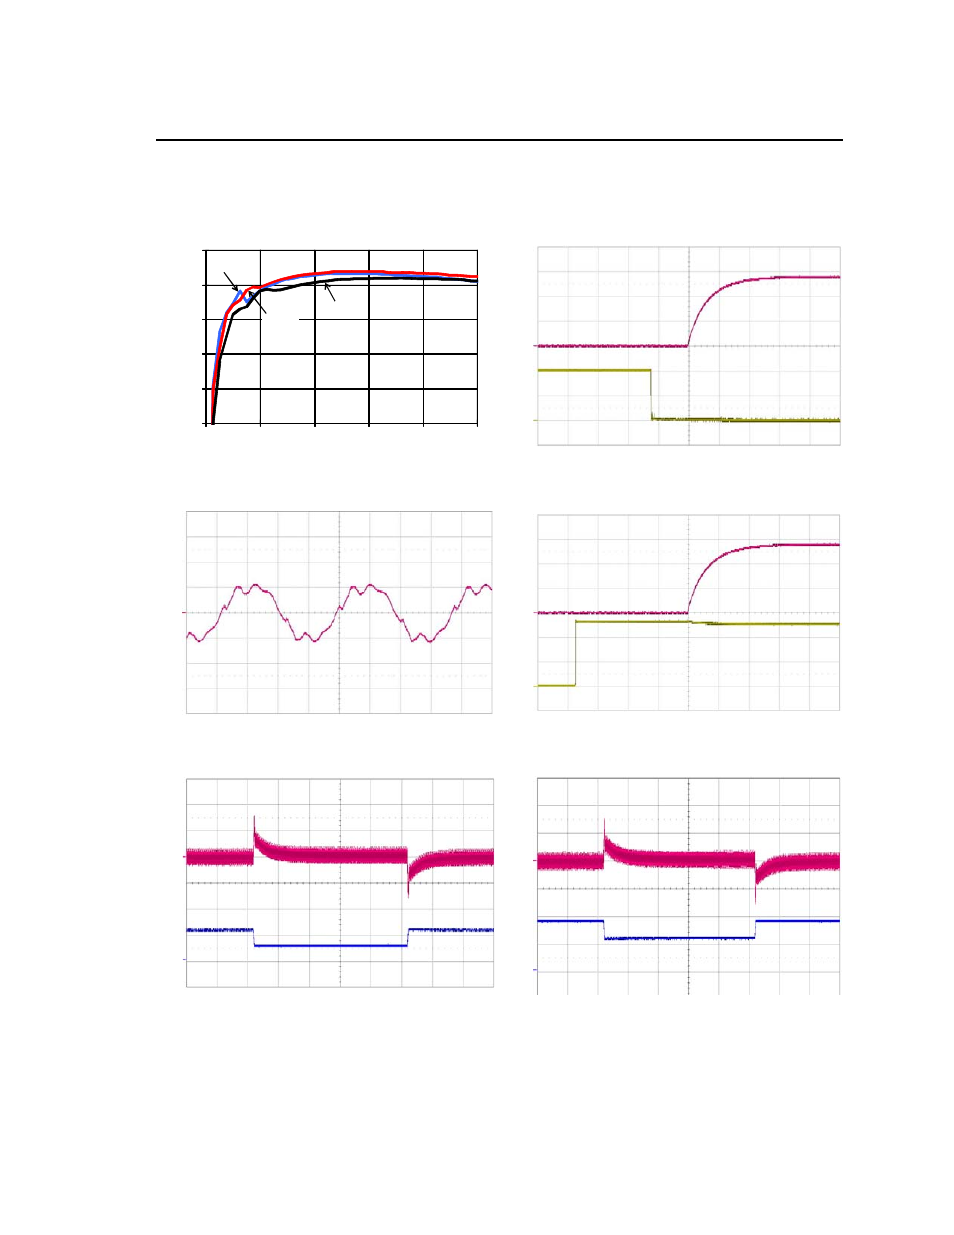
The following figures provide typical characteristics for the JNC350R (28V, 12.5A) at 25ºC. The figures are identical
for either positive or negative Remote On/Off logic.
EF
F
IC
IEN
C
Y
(
%
)
70
75
80
85
90
95
0
2.5
5
7.5
10
12.5
Vin=18V
Vin=24V
Vin=36V
O
n
/Off
V
O
LTA
G
E
O
UT
P
U
T
V
O
LT
A
G
E
V
ON/
O
FF
(V
) (2V
/di
v)
V
O
(V
) (10
V
/div)
OUTPUT CURRENT, I
o
(A)
TIME, t (20ms/div)
Figure 1. Converter Efficiency versus Output
Current.
Figure 4. Typical Start-Up Using negative Remote
On/Off; C
o,ext
= 470µF.
O
U
TPU
T
VO
LT
A
G
E
V
O
(V
) (50mV
/d
iv
)
IN
PU
T VO
LTA
G
E
O
U
TPU
T
VO
LTA
G
E
V
in
(V
) (
10V
/div)
V
O
(V
) (1
0
V
/d
iv
)
TIME, t (1
s/div)
TIME, t (20ms/div)
Figure 2. Typical Output Ripple and Noise at Room
Temperature and 24Vin; I
o
= I
o,max
; C
o,ext
= 470µF.
Figure 5. Typical Start-Up from V
IN
, on/off enabled
prior to V
IN
step; C
o,ext
= 470µF.
O
U
TPU
T
CU
RRE
NT
OU
TP
UT VO
LTAG
E
I
O
(A
) (5A
/d
iv
)
V
O
(V
) (200
mV
/div)
O
U
TPU
T
CU
RRE
NT
OU
TP
UT VO
LTAG
E
I
O
(A
) (5A
/d
iv
)
V
O
(V
) (20
0
mV
/div)
TIME, t (1ms/div)
TIME, t (1ms/div)
Figure 3. Standard JNC350R Transient Response to
Dynamic Load Change from 25% to 50% to 25% of
Full Load at Room Temperature and 24 Vdc Input;
0.1A/uS, C
o,ext
= 470µF
Figure 6. Standard JNC350R Transient Response to
Dynamic Load Change from 50% to 75% to 50% of
Full Load at Room Temperature and 24 Vdc Input;
0.1A/uS, C
o,ext
= 470µF