Characteristic curves (continued) – GE Industrial Solutions Naos Raptor 3A User Manual
Page 7
Data Sheet
December 6, 2010
Naos Raptor 3A: Non-isolated DC-DC Power Modules
4.5 – 14Vdc input; 0.59Vdc to 6Vdc Output; 3A output current
LINEAGE
POWER
7
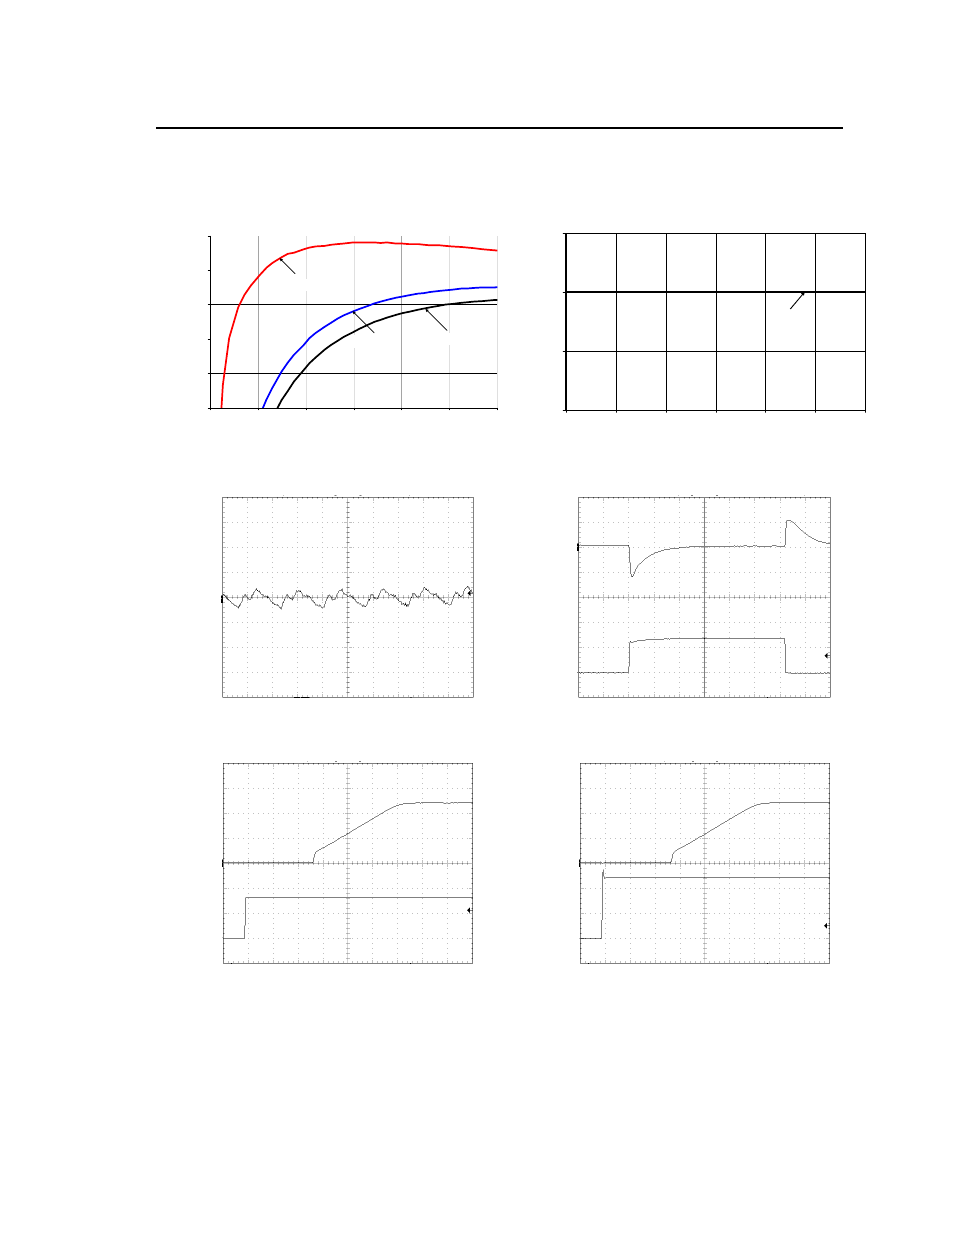
Characteristic Curves (continued)
The following figures provide typical characteristics for the Naos Raptor 3A module at 1.2Vout and at 25ºC.
EF
FI
CI
EN
C
Y
, η
(%)
65
70
75
80
85
90
0
0.5
1
1.5
2
2.5
3
Vin = 4.5V
Vin = 12V
Vin = 14V
OUTPUT
CURR
E
N
T
, I
o
(A
)
1
2
3
4
25
35
45
55
65
75
85
NC
OUTPUT CURRENT, I
O
(A)
AMBIENT TEMPERATURE, T
A
O
C
Figure 7. Converter Efficiency versus Output Current.
Figure 8. Derating Output Current versus Ambient
Temperature and Airflow.
O
U
T
P
U
T
VOLTAGE
V
O
(V)
(1
0m
V
/d
iv
)
OUT
P
UT
CU
RR
ENT
,
OU
T
P
UT
VO
LT
A
G
E
I
O
(
A
)
(1
Adi
v)
V
O
(V
) (1
00
mV
/d
iv
)
TIME, t (1
μs/div)
TIME, t (100
μs /div)
Figure 9. Typical output ripple and noise (V
IN
= 12V, I
o
=
I
o,max
).
Figure 10. Transient Response to Dynamic Load
Change from 0% to 50% to 0% with V
IN
=12V.
ON
/OF
F
VO
LT
A
G
E
OUT
P
UT
V
O
LT
A
G
E
V
ON
/O
F
F
(V
) (5
V
/di
v)
V
O
(
V
) (
500
mV
/d
iv
)
IN
PU
T
VO
LTA
G
E
OUTPU
T
V
O
LT
AG
E
V
IN
(V
)
(5V/
div)
V
O
(V)
(500
mV
/d
iv
)
TIME, t (1ms/div)
TIME, t (1ms/div)
Figure 11. Typical Start-up Using On/Off Voltage (I
o
=
I
o,max
).
Figure 12. Typical Start-up Using Input Voltage (V
IN
=
12V, I
o
= I
o,max
).