2a picotlynx, Non-isolated dc-dc power modules, Data sheet – GE Industrial Solutions 2A PicoTLynx User Manual
Page 6: Characteristic curves
GE
Data Sheet
2A PicoTLynx
TM
: Non-Isolated DC-DC Power Modules
3Vdc –14Vdc input; 0.6Vdc to 5.5Vdc output; 2A Output Current
February 26, 2013
©2013 General Electric Company. All rights reserved.
Page 6
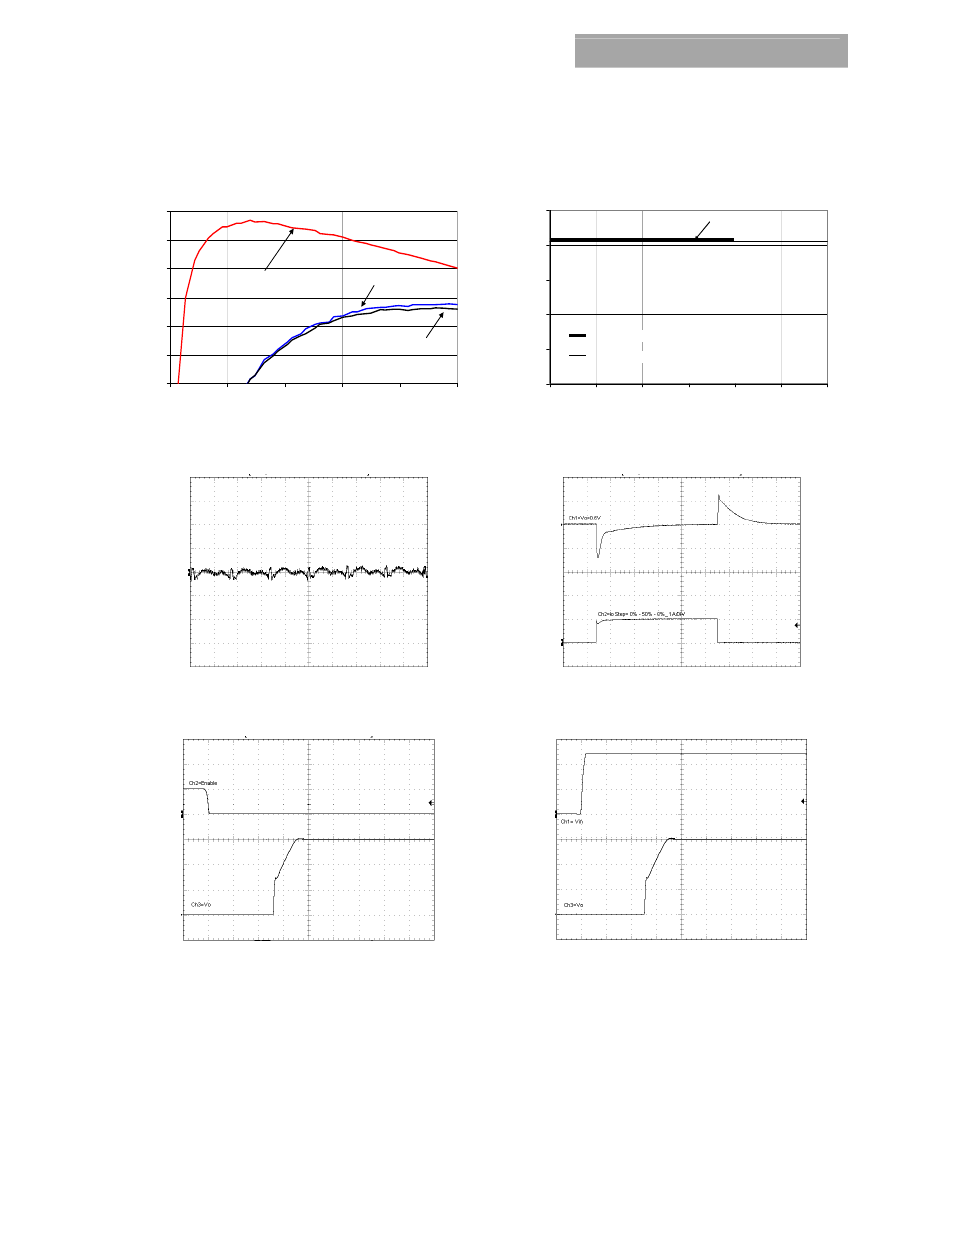
Characteristic Curves
The following figures provide typical characteristics for the APXS002A0X-SRZ (0.6V, 2A) at 25
o
C.
EFFIC
IE
N
CY,
η
(
%
)
55
60
65
70
75
80
85
0
0.4
0.8
1.2
1.6
2
Vin=14V
Vin=12V
Vin=3V
OUT
PUT
CURRENT
, I
o (
A)
0.0
0.5
1.0
1.5
2.0
2.5
45
55
65
75
85
95
105
NC
Standard Test
Extended Test
OUTPUT CURRENT, I
O
(A)
AMBIENT TEMPERATURE, T
A
O
C
Figure 1. Converter Efficiency versus Output Current.
Figure 2. Derating Output Current versus Ambient
Temperature and Airflow.
OUTPUT
V
O
LTAG
E
V
O
(V
) (10m
V/
di
v)
OUTPUT
CU
RRE
NT,
OUTPU
T
VO
LTAG
E
I
O
(A
) (
1Adi
v)
V
O
(V
) (1
00
m
V/
di
v)
TIME, t (1
μs/div) TIME,
t
(20
μs /div)
Figure 3. Typical output ripple and noise (V
IN
= 12V, I
o
= I
o,max
).
Figure 4. Transient Response to Dynamic Load Change from
0% to 50% to 0% .
OUTPUT
V
O
LTAGE
ON/
O
FF
VO
LT
AGE
V
O
(V
) (2
00
m
V/
di
v)
V
ON
/OF
F
(V
) (5V/
div
)
O
U
TPU
T
VO
LTA
G
E
IN
PUT
VO
LTA
G
E
V
O
(V
) (
20
0m
V/
di
v)
V
IN
(V
) (5V/
div
)
TIME, t (1ms/div)
TIME, t (1ms/div)
Figure 5. Typical Start-up Using On/Off Voltage (I
o
= I
o,max,
V
in=
12V,Cext=
22uF).
Figure 6. Typical Start-up Using Input Voltage (V
IN
= 12V, I
o
=
I
o,max
).