Characteristic curves (continued), Tlynx – GE Industrial Solutions TLynx User Manual
Page 8
Data Sheet
August 13, 2013
TLynx
TM
: Non-isolated DC-DC Power Modules:
2.4 – 5.5Vdc input; 0.6Vdc to 3.63Vdc output; 20A output current
LINEAGE
POWER
8
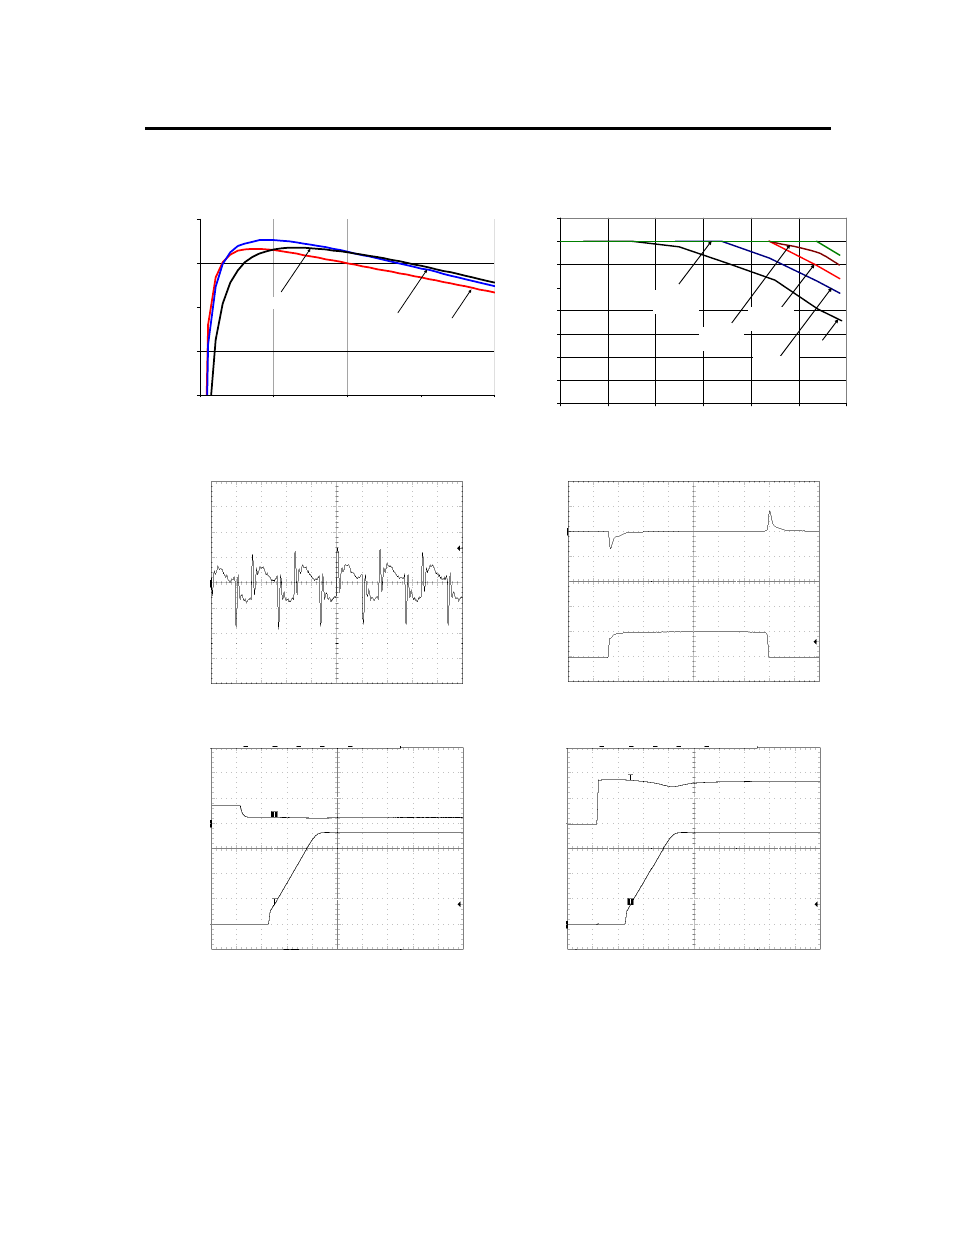
Characteristic Curves (continued)
The following figures provide typical characteristics for the TLynx
TM
at 1.8Vo and at 25
o
C.
EF
FI
CI
EN
C
Y
, η
(%)
75
80
85
90
95
0
5
10
15
20
Vin=2.4V
Vin=3.3V
Vin=5.5V
O
U
T
P
UT
CU
RRE
NT
, I
o
(A
)
6
8
10
12
14
16
18
20
22
25
35
45
55
65
75
85
NC
0.5m/s
(100LFM)
1m/s
(200LFM)
2m/s
(400LFM)
1.5m/s
(300LFM)
OUTPUT CURRENT, I
O
(A)
AMBIENT TEMPERATURE, T
A
O
C
Figure 13. Converter Efficiency versus Output Current.
Figure 14. Derating Output Current versus Ambient
Temperature and Airflow.
O
U
T
P
U
T
VOLTAGE
V
O
(V)
(1
0m
V
/d
iv
)
OUT
P
UT
CU
RR
ENT
,
OU
T
P
UT
VO
LT
A
G
E
I
O
(
A
)
(
1
0A
di
v)
V
O
(V)
(
500
m
V
/d
iv
)
TIME, t (1
μs/div) TIME,
t
(100
μs /div)
Figure 15. Typical output ripple and noise (V
IN
= 3.3V, I
o
= I
o,max
).
Figure 16. Transient Response to Dynamic Load
Change from 0% to 50% to 0% with V
IN
=3.3V.
OU
T
P
U
T
V
O
LTA
G
E
O
N
/O
FF
VOLTAG
E
V
O
(V
) (5
00
mV
/d
iv
)
V
ON
/O
F
F
(V
) (5
V
/d
iv
)
O
U
T
P
UT
V
O
LT
A
G
E
I
N
P
U
T
V
O
LT
A
G
E
V
O
(V
) (5
00
mV
/d
iv
)
V
IN
(V
) (
2V/div
)
TIME, t (2ms/div)
TIME, t (2ms/div)
Figure 17. Typical Start-up Using On/Off Voltage (I
o
=
I
o,max
).
Figure 18. Typical Start-up Using Input Voltage (V
IN
=
3.3V, I
o
= I
o,max
).