Key features, Economical designs, Higher conductivity limits – GE P&W Ultrapure and Drinking Water TOC Analyzers - Sievers 500 RLe Brochure User Manual
Page 3: References, The 500 rl, Comes in two models to meet your needs. the 500 rl
Key Features
Economical Designs
The 500 RL
e
comes in two models to meet your needs. The
500 RL
e
with Standard iOS (Integrated On-Line Sampling
System) utilizes the familiar Sievers sample inlet device,
allowing for on-site calibration and running standards
and grab samples. The 500 RL
e
Base Model utilizes a
simplified sample inlet block, facilitating continuous on-
line operation. On-site calibration may be performed
using an optional iOS accessory. The 500 RL
e
Base Model
is cost-competitive with even the simplest TOC sensors,
while still providing superior analytical performance and
optional on-site calibration.
Higher Conductivity Limits
The 500 RL
e
incorporates design elements from the
Sievers 800 and 900 Series that enable reagentless
TOC measurement in waters up to 25 μS/cm at neutral
pH. Equally as important, this design enhancement
means that upsets and abnormal fluctuations in UPW
system conductivity from plant transients do not affect
analytical performance.
Sensitivity, Accuracy, Instrument-to-Instrument
Matching, and Stability
With microelectronic TOC limits being driven ever lower,
it is critical that TOC analyzers operate accurately
and reliably at sub-ppb levels. The 500 RL
e
achieves
the lowest detection limit of any TOC analyzer on the
market — 0.03 ppb — and provides the confidence
that all organics are being fully recovered regardless
of chemical composition. The automated advanced
TOC zero function provides world class Instrument-
to-Instrument matching of ± 0.05 ppb C, allowing you
to compare critical differences between water loops
at your site or on the other side of the world. The
combination of analytical sensitivity, Instrument-to-
Instrument matching, robustness, and stable sub-ppb
performance provides confidence that critical UPW
and fabrication processes are controllable and that
even the most subtle trends can be closely monitored
to protect your manufacturing processes.
References
1
Godec, Richard D., “Monitoring and Controlling UPW Organic Nitrogen Con-
tamination to Improve Immersion Photolithography Process Control.” Presented
at ULTRAPURE WATER Conference, Portland, OR, November 2011, Tall Oaks
Publishing, Inc.
2
Godec, Richard D., ”The Performance Comparison of Ultrapure Water TOC
Analyzers using an Automated Standard Addition Apparatus.” Published and
copyrighted by Semiconductor Pure Water and Chemical Conference, 2000
Proceedings.
3
Kauffman, Jon S.,Ph.D., “Validating On-Line TOC Analyzers for Real-Time
Release.” Pharmaceutical Manufacturing, Nov/Dec 2006.
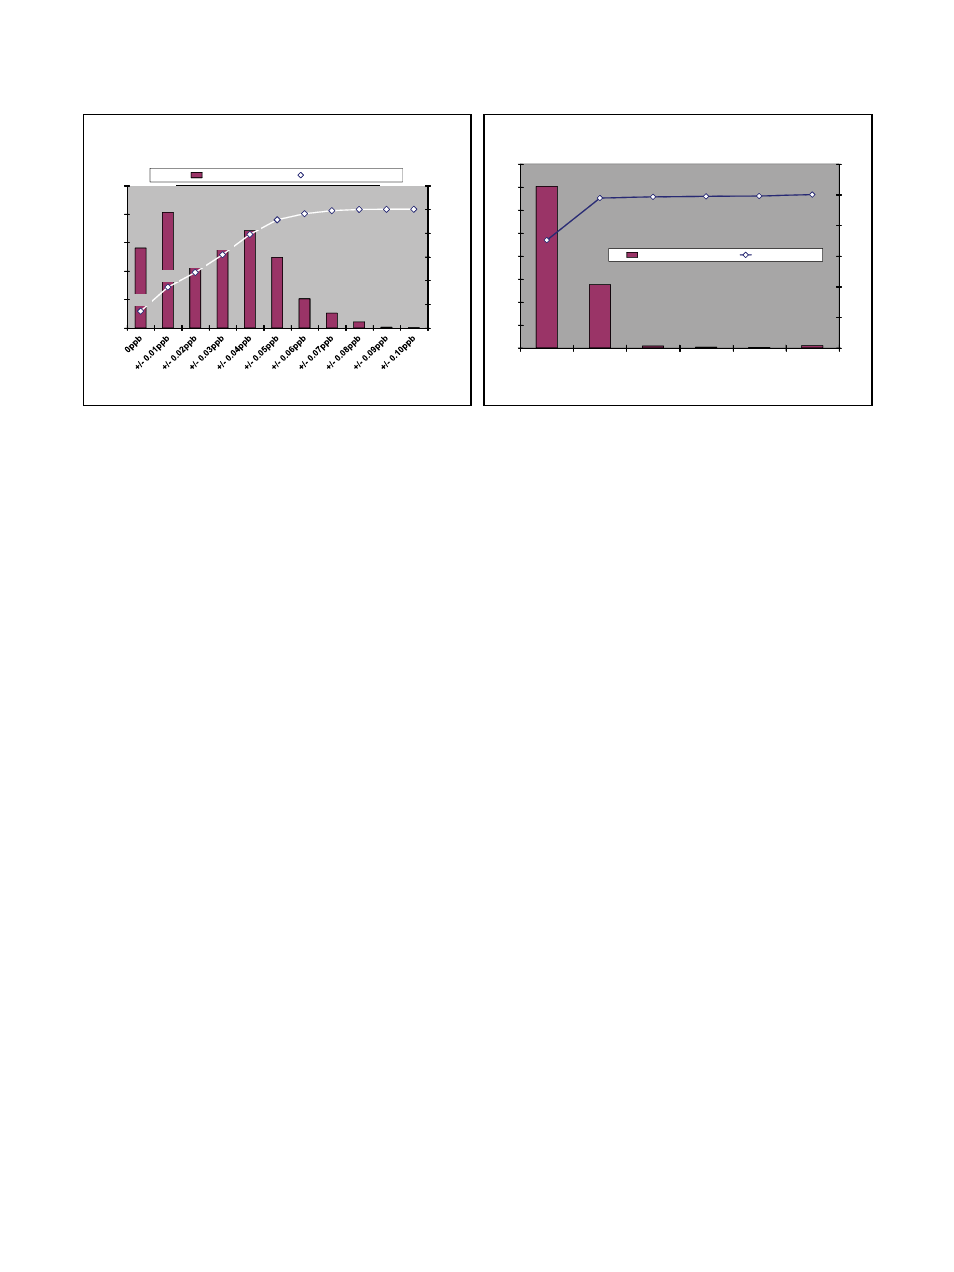
Figure 3. Instrument-to-Instrument study results proving the
± 0.05 ppb C match between five analyzers
Figure 4. LOD study results proving the 0.03 limit of detection
for multiple 500 RL
e
Analyzers
14%
34%
47%
62%
79%
91%
96% 99% 100% 100% 100%
0%
20%
40%
60%
80%
100%
120%
0%
5%
10%
15%
20%
25%
C
um
ul
at
iv
e
%
%
o
f T
ot
al
R
ea
di
ng
s
Instrument-to-Instrument Matching (ppb C)
91% of Measurements are within
± 0.05 ppb C
5 Separate 500 RLe On-line TOC Analyzers
- Matching on Same 0.3 ppb C UPW
Data Collected for 2 Months n = 155,925 data points
Difference
Cumulative
70%
98%
99%
99%
99%
100%
0%
20%
40%
60%
80%
100%
120%
0%
10%
20%
30%
40%
50%
60%
70%
80%
0-0.01
0.01-0.02 0.02-0.03 0.03-0.04 0.04-0.05
> 0.05
LOD (ppb C)
98% of LODs are Less that 0.02 ppb C
Five Each On-line 500 RLe TOC Analyzers- Same UPW- 32 Days
LODs Calculated Using a 10 PT Moving Average N = 44,272 Separate LOD Analyses
Percent of values
Cumulative