Drying time table…… 8l (continued), Drying time table – Grain Systems PNEG-1650 User Manual
Page 89
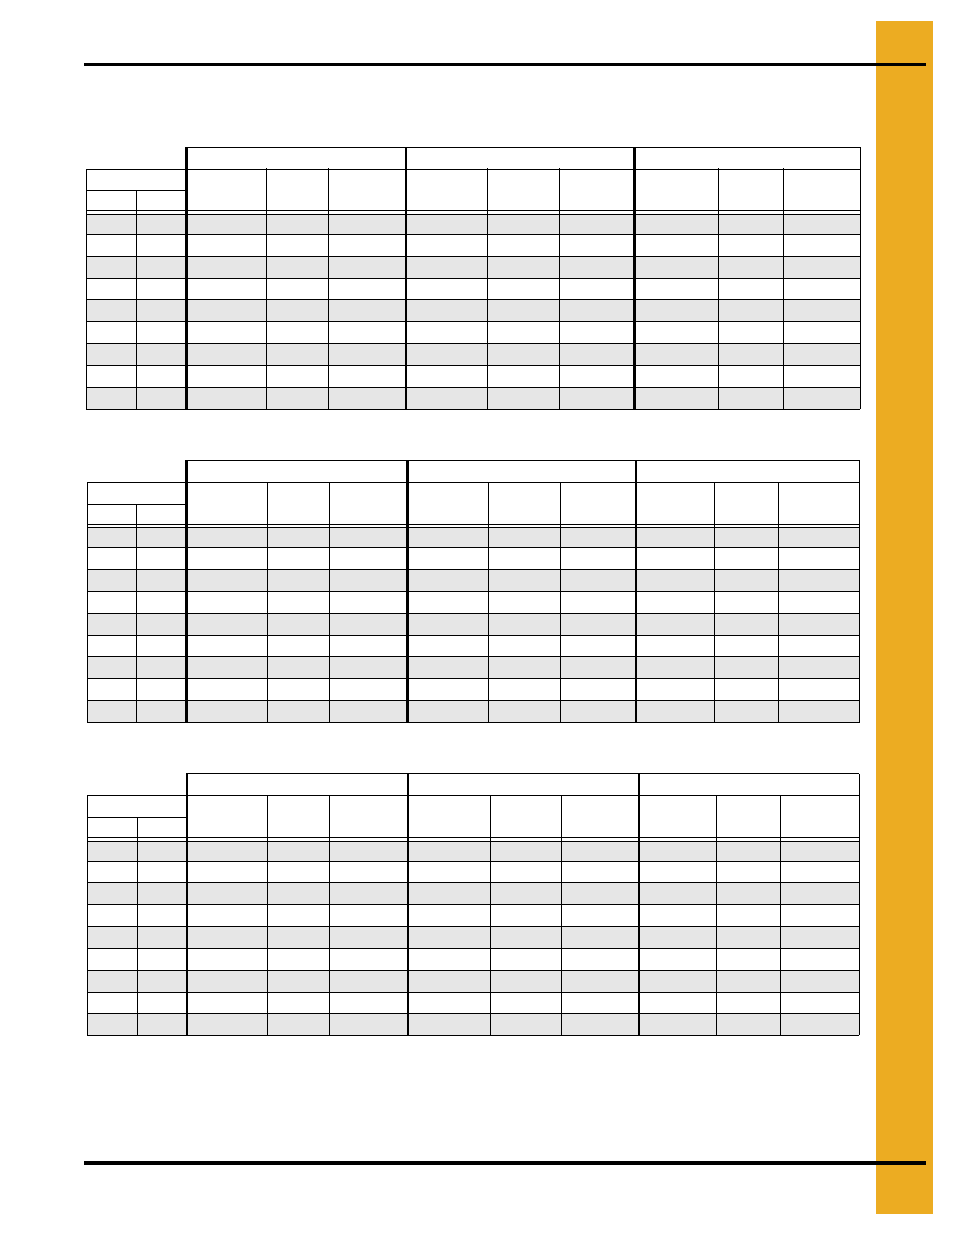
1. Drying Time Table
PNEG-1650 GSI Portable Drying Charts
89
Drying Time Table……..1038L (Continued)
Wheat, Barley, Milo...Dry and Cool
Soybeans...Dry and Cool
Canola...Dry and Cool
The above drying capacities are estimates based on drying principles, field results and computer
simulations. Variances may occur due to grain physiological factors (kernel size, chemical composition,
variety, maturity), excessive fines, weather conditions, etc.
140°F
155°F
175°F
Moisture
% Unload
Rate
Dry
Time
Capacity
Dry BPH
% Unload
Rate
Dry
Time
Capacity
Dry BPH
% Unload
Rate
Dry
Time
Capacity
Dry BPH
% In % Out
15
13
20
32
1080
24
28
1260
28
23
1500
16
13
15
43
814
18
37
950
21
31
1130
17
13
12
53
663
14
45
774
17
38
922
18
13
11
62
564
12
53
658
15
45
783
19
13
9
71
490
11
61
572
13
51
681
20
13
8
81
432
9
69
504
11
58
600
21
13
7
91
383
8
78
447
10
66
532
23
13
6
114
306
7
98
357
8
82
425
25
13
5
142
246
5
122
287
6
102
342
120°F
130°F
140°F
Moisture
% Unload
Rate
Dry
Time
Capacity
Dry BPH
% Unload
Rate
Dry
Time
Capacity
Dry BPH
% Unload
Rate
Dry
Time
Capacity
Dry BPH
% In % Out
15
13
23
28
1229
26
25
1404
30
22
1580
16
13
17
38
926
20
33
1058
22
29
1191
17
13
14
46
755
16
40
863
18
36
971
18
13
12
54
641
14
48
733
15
42
825
19
13
10
63
558
12
55
637
13
49
717
20
13
9
71
491
10
62
561
12
55
632
21
13
8
80
436
9
70
498
10
62
561
23
13
7
100
348
7
88
398
8
78
447
25
13
5
125
280
6
109
320
7
97
360
120°F
140°F
160°F
Moisture
% Unload
Rate
Dry
Time
Capacity
Dry BPH
% Unload
Rate
Dry
Time
Capacity
Dry BPH
% Unload
Rate
Dry
Time
Capacity
Dry BPH
% In % Out
11
9
19
34
1034
25
26
1330
30
21
1625
12
9
15
45
779
19
35
1002
23
29
1225
13
9
12
55
635
15
43
817
19
35
998
14
9
10
65
540
13
50
694
16
41
848
15
9
9
74
469
11
58
603
14
47
737
16
9
8
84
413
10
66
532
12
54
650
17
9
7
95
367
9
74
472
11
61
577
18
9
6
107
327
8
83
421
10
68
514
19
9
5
119
293
7
93
376
9
76
460
Drying table based on 100% unload rate of…...5347 BPH