Drying time table…… and 1118 (continued), Drying time table – Grain Systems PNEG-1650 User Manual
Page 18
1. Drying Time Table
18
PNEG-1650 GSI Portable Drying Charts
Drying Time Table……..118 and 1118 (Continued)
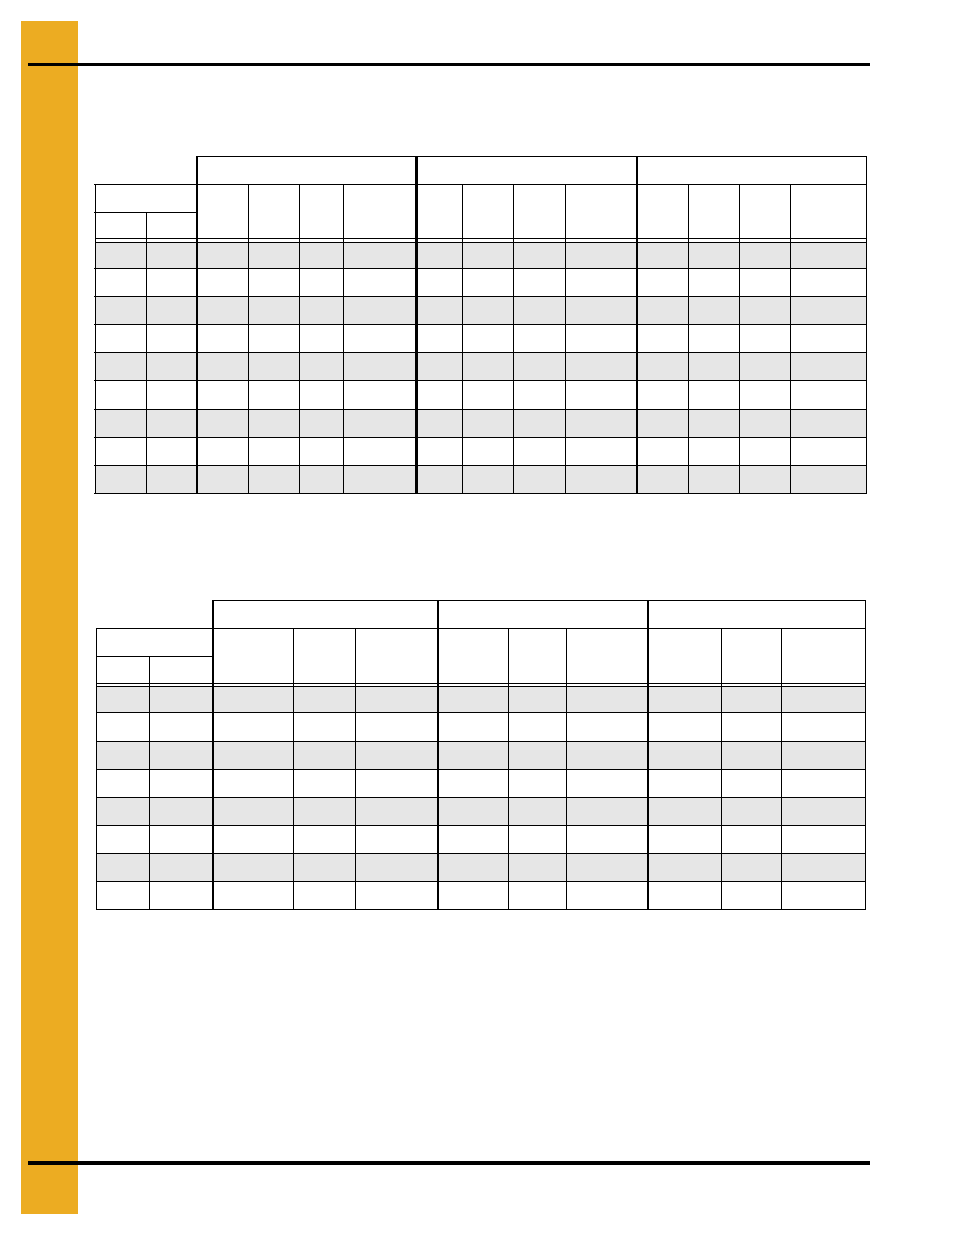
Soybeans...Dry and Cool (Automatic Batch)
Wheat...Full Heat (Continuous Flow)
The above drying capacities are estimates based on drying principles, field results and computer
simulations. Variances may occur due to grain physiological factors (kernel size, chemical composition,
variety, maturity), excessive fines, weather conditions, etc.
120°F
130°F
140°F
Moisture
Dry
Min.
Time
Hrs
Cool
Min.
Capacity
Dry BPH
Dry
Min.
Time
Hrs
Cool
Min.
Capacity
Dry BPH
Dry
Min.
Time
Hrs
Cool
Min.
Capacity
Dry BPH
% In % Out
15
13
28
0.47
15
466
25
0.41
15
499
16
13
38
0.63
15
397
33
0.55
15
429
29
0.49
15
458
17
13
46
0.77
15
349
40
0.67
15
380
36
0.60
15
408
18
13
54
0.91
15
313
48
0.79
15
342
42
0.71
15
369
19
13
63
1.04
15
284
55
0.91
15
312
49
0.81
15
337
20
13
71
1.18
15
259
62
1.04
15
285
55
0.92
15
310
21
13
80
1.33
15
237
70
1.17
15
262
62
1.04
15
285
22
13
90
1.50
15
217
79
1.31
15
240
70
1.16
15
262
23
13
100
1.67
15
198
88
1.46
15
220
78
1.30
15
241
Drying table based on 100% meter roll speed of…...2533 BPH
Unload timer set for…...9.8 minutes
140°F
155°F
175°F
Moisture
% Unload
Rate
Dry
Time
Capacity
Dry BPH
% Unload
Rate
Dry
Time
Capacity
Dry BPH
% Unload
Rate
Dry
Time
Capacity
Dry BPH
% In
% Out*
15
14
38
26
960
44
22
1120
16
14
29
34
724
33
29
844
40
25
1005
17
14
23
42
590
27
36
688
32
30
819
18
14
20
50
501
23
42
585
27
36
696
19
14
17
57
436
20
49
508
24
41
605
20
14
15
65
384
18
55
448
21
47
533
21
14
13
73
341
16
62
398
19
52
473
22
14
12
82
304
14
70
355
17
59
422
*Represents the target moisture out of the dryer. Expected final moisture in the bin is…...13.0%
Drying table based on 100% meter roll speed of…...2533 BPH