Drying time table…… 8l, Drying time table – Grain Systems PNEG-1650 User Manual
Page 88
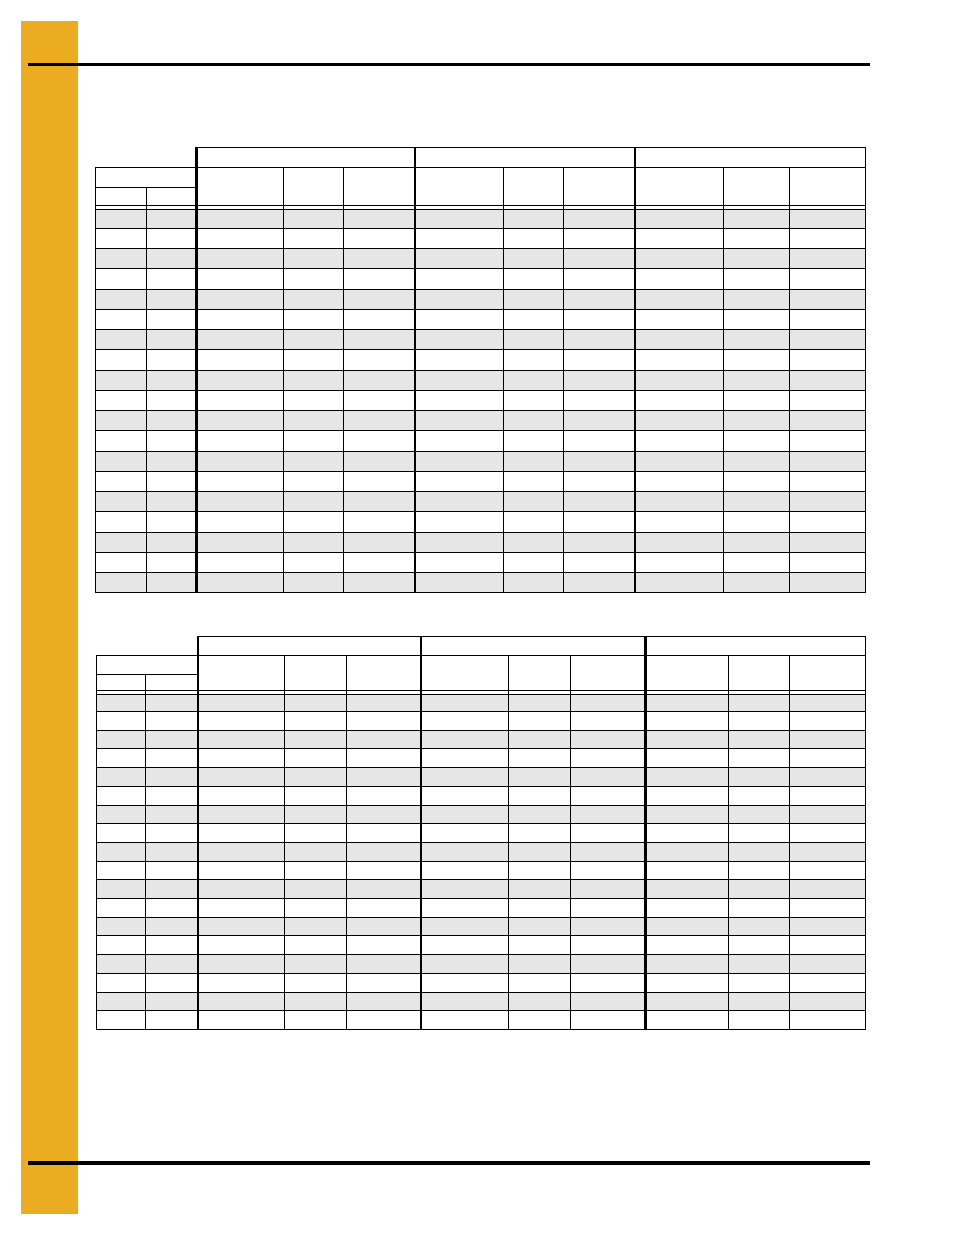
1. Drying Time Table
88
PNEG-1650 GSI Portable Drying Charts
Drying Time Table……..1038L
Corn...Dry and Cool
Corn...Full Heat
The above drying capacities are estimates based on drying principles, field results and computer
simulations. Variances may occur due to grain physiological factors (kernel size, chemical composition,
variety, maturity), excessive fines, weather conditions, etc.
190°F
210°F
230°F
Moisture
% Unload
Rate
Dry
Time
Capacity
Dry BPH
% Unload
Rate
Dry
Time
Capacity
Dry BPH
% Unload
Rate
Dry
Time
Capacity
Dry BPH
% In
% Out
17
15
36
18
1914
41
16
2187
18
15
27
24
1443
31
21
1649
19
15
22
30
1176
25
26
1344
28
23
1512
20
15
19
35
999
21
31
1142
24
27
1285
21
15
16
40
869
19
35
993
21
31
1117
22
15
14
46
765
16
40
875
18
35
984
23
15
13
51
679
15
45
777
16
40
874
24
15
11
58
606
13
50
693
15
45
779
25
15
10
64
542
12
56
619
13
50
697
26
15
9
72
486
10
63
555
12
56
625
27
15
8
80
437
9
70
499
10
62
561
28
15
7
89
393
8
78
449
9
69
506
29
15
7
98
355
8
86
406
9
76
457
30
15
6
108
322
7
95
368
8
84
414
31
15
5
119
293
6
104
335
7
93
377
32
15
5
130
268
6
114
306
6
101
345
33
15
5
142
246
5
124
282
6
110
317
34
15
4
153
228
5
134
260
5
119
293
35
15
4
165
212
5
144
242
5
128
272
190°F
210°F
230°F
Moisture
% Unload
Rate
Dry
Time
Capacity
Dry BPH
% Unload
Rate
Dry
Time
Capacity
Dry BPH
% Unload
Rate
Dry
Time
Capacity
Dry BPH
%
In
%
Out*
18
17
110
9
5892
126
8
6734
19
17
66
15
3513
75
13
4015
84
12
4516
20
17
49
20
2610
56
18
2983
63
16
3355
21
17
40
25
2123
45
22
2427
51
19
2730
22
17
34
29
1808
39
25
2066
43
23
2324
23
17
29
33
1577
34
29
1802
38
26
2027
24
17
26
38
1393
30
33
1592
34
29
1791
25
17
23
42
1239
26
37
1416
30
33
1593
26
17
21
47
1105
24
41
1263
27
37
1421
27
17
18
53
988
21
46
1129
24
41
1270
28
17
17
59
884
19
52
1010
21
46
1136
29
17
15
66
792
17
58
905
19
51
1019
30
17
13
74
712
15
64
813
17
57
915
31
17
12
82
642
14
71
733
15
64
825
32
17
11
90
581
12
79
664
14
70
747
33
17
10
99
528
11
87
604
13
77
679
34
17
9
108
483
10
95
552
12
84
621
35
17
8
118
445
10
103
508
11
92
572
*Represents the target moisture out of the dryer. Expected final moisture in the bin is
…...
15.0%
Drying table based on 100% unload rate of
…...
5347 BPH