Drying time table…… 6l, Drying time table – Grain Systems PNEG-1650 User Manual
Page 82
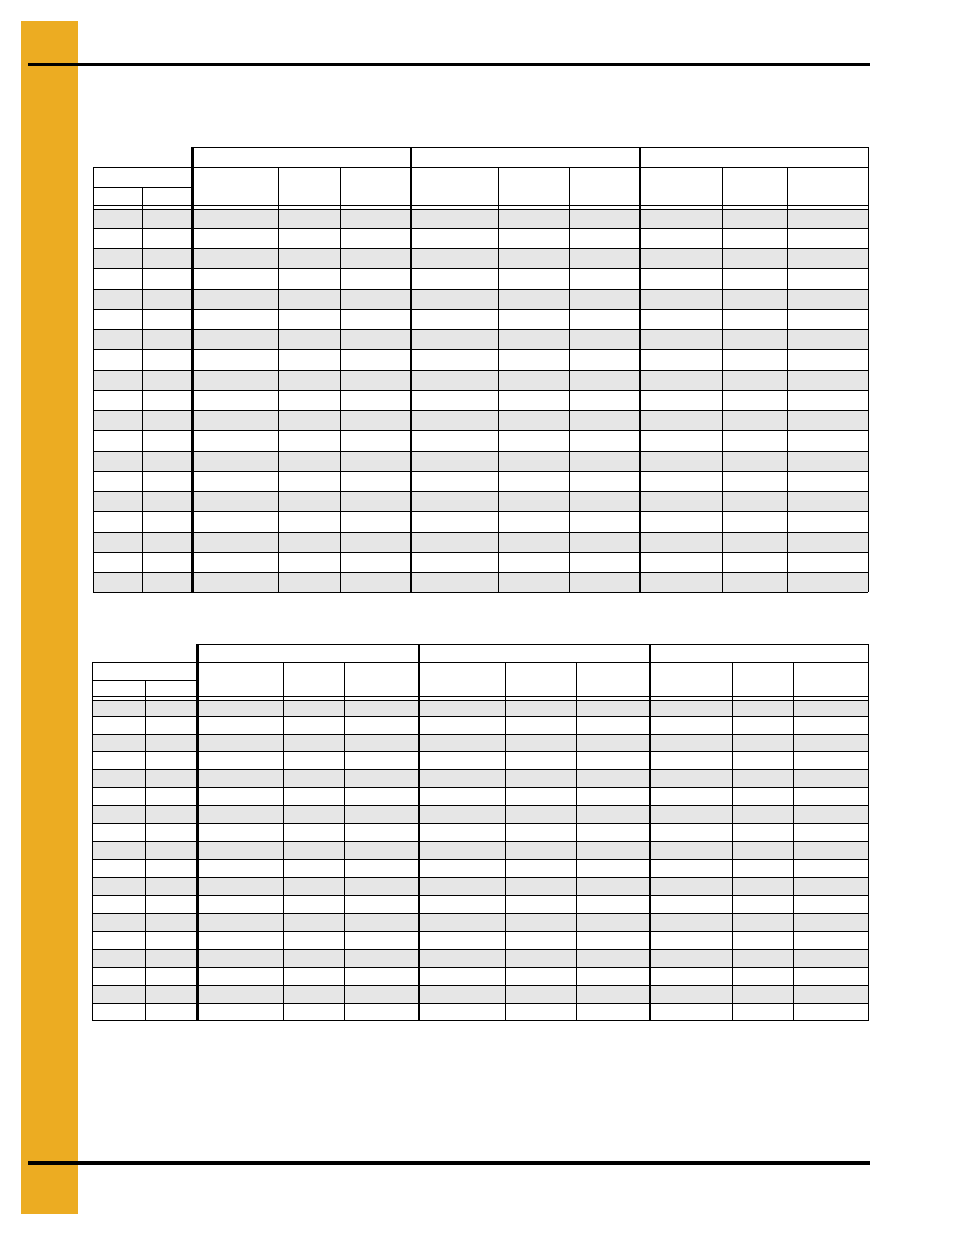
1. Drying Time Table
82
PNEG-1650 GSI Portable Drying Charts
Drying Time Table……..4026L
Corn...Dry and Cool
Corn...Full Heat
The above drying capacities are estimates based on drying principles, field results and computer
simulations. Variances may occur due to grain physiological factors (kernel size, chemical composition,
variety, maturity), excessive fines, weather conditions, etc.
190°F
210°F
230°F
Moisture
% Unload
Rate
Dry
Time
Capacity
Dry BPH
% Unload
Rate
Dry
Time
Capacity
Dry BPH
% Unload
Rate
Dry
Time
Capacity
Dry BPH
% In
% Out
17
15
33
20
1221
38
17
1396
18
15
25
26
921
29
23
1052
19
15
21
32
751
23
28
858
26
25
965
20
15
17
38
638
20
33
729
22
29
820
21
15
15
43
554
17
38
634
19
34
713
22
15
13
49
488
15
43
558
17
38
628
23
15
12
55
434
14
48
496
15
43
558
24
15
11
62
387
12
54
442
14
48
497
25
15
9
69
346
11
61
395
12
54
445
26
15
8
77
310
10
68
354
11
60
399
27
15
8
86
279
9
75
318
10
67
358
28
15
7
95
251
8
83
287
9
74
323
29
15
6
106
227
7
92
259
8
82
291
30
15
6
116
206
6
102
235
7
91
264
31
15
5
128
187
6
112
214
7
99
241
32
15
5
140
171
5
122
196
6
109
220
33
15
4
152
157
5
133
180
6
118
202
34
15
4
165
145
5
144
166
5
128
187
35
15
4
177
135
4
155
154
5
138
174
190°F
210°F
230°F
Moisture
% Unload
Rate
Dry
Time
Capacity
Dry BPH
% Unload
Rate
Dry
Time
Capacity
Dry BPH
% Unload
Rate
Dry
Time
Capacity
Dry BPH
% In
% Out*
18
17
104
9
3798
119
8
4340
19
17
62
16
2264
71
14
2588
80
12
2911
20
17
46
21
1682
53
19
1922
59
17
2163
21
17
37
26
1369
43
23
1564
48
20
1760
22
17
32
31
1165
36
27
1332
41
24
1498
23
17
28
35
1016
32
31
1162
36
27
1307
24
17
25
40
898
28
35
1026
32
31
1155
25
17
22
45
799
25
39
913
28
35
1027
26
17
19
50
712
22
44
814
25
39
916
27
17
17
56
637
20
49
728
22
44
819
28
17
16
63
570
18
55
651
20
49
733
29
17
14
70
511
16
61
584
18
55
657
30
17
13
78
459
14
68
524
16
61
590
31
17
11
87
414
13
76
473
15
67
532
32
17
10
96
374
12
84
428
13
75
481
33
17
9
105
340
11
92
389
12
82
438
34
17
9
115
311
10
101
356
11
90
400
35
17
8
125
287
9
109
328
10
97
369
*Represents the target moisture out of the dryer. Expected final moisture in the bin is
…...
15.0%
Drying table based on 100% unload rate of
…...
3658 BPH