Drying time table…… 4 (continued), Drying time table – Grain Systems PNEG-1650 User Manual
Page 52
1. Drying Time Table
52
PNEG-1650 GSI Portable Drying Charts
Drying Time Table……..2314 (Continued)
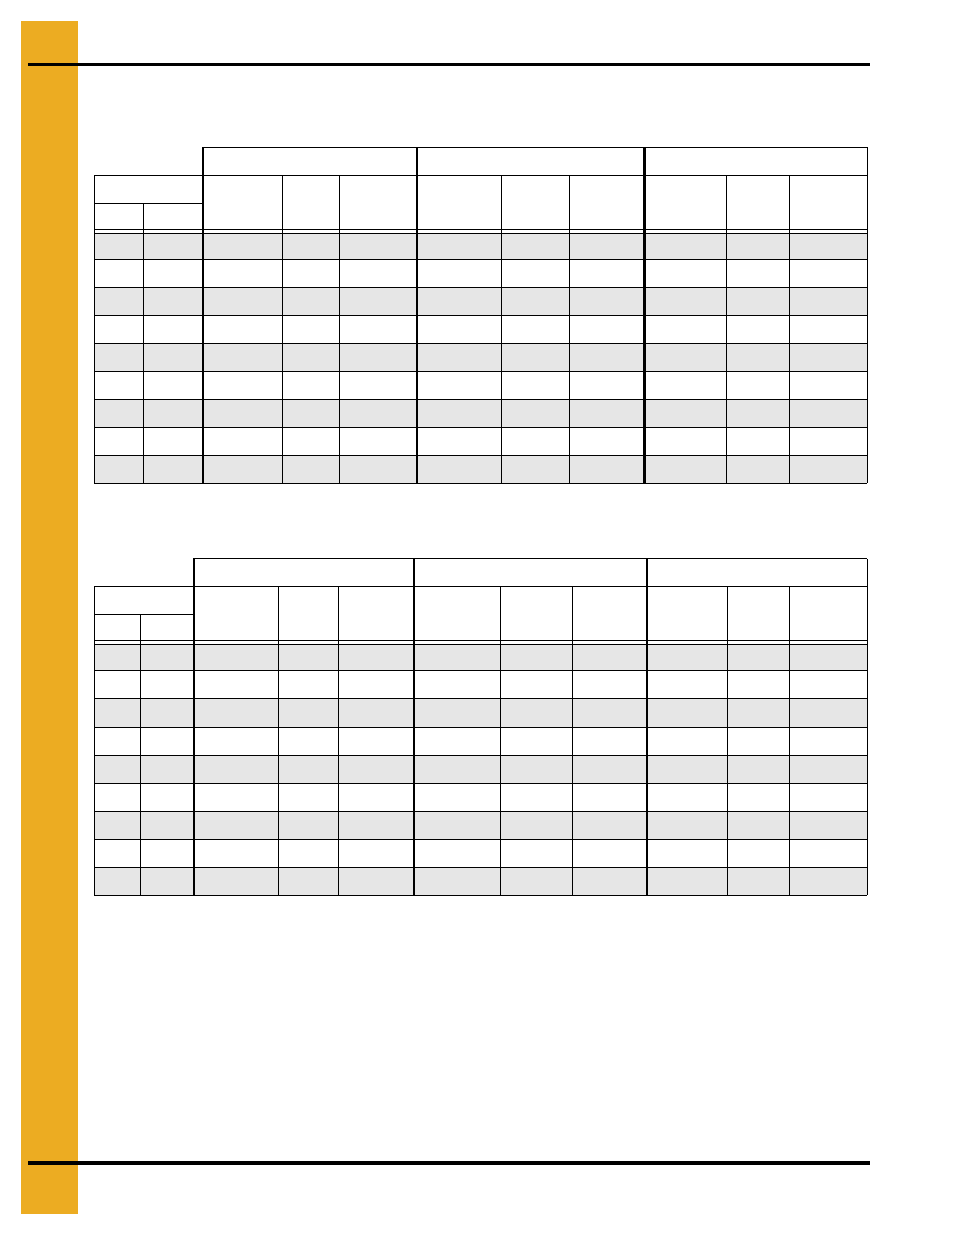
Soybeans...Dry and Cool (#1 and #2 Cooling)
Canola...Dry and Cool
The above drying capacities are estimates based on drying principles, field results and computer
simulations. Variances may occur due to grain physiological factors (kernel size, chemical composition,
variety, maturity), excessive fines, weather conditions, etc.
120°F
130°F
140°F
Moisture
% Unload
Rate
Dry
Time
Capacity
Dry BPH
% Unload
Rate
Dry
Time
Capacity
Dry BPH
% Unload
Rate
Dry
Time
Capacity
Dry BPH
%
In
%
Out
15
13
32
29
622
36
25
710
41
22
799
16
13
24
38
469
27
33
536
31
30
602
17
13
19
47
382
22
41
437
25
36
491
18
13
16
55
325
19
48
371
21
43
417
19
13
14
64
282
16
56
322
18
49
363
20
13
13
72
249
14
63
284
16
56
320
21
13
11
81
221
13
71
252
14
63
284
23
13
9
102
176
10
89
201
11
79
226
25
13
7
126
142
8
111
162
9
98
182
Drying table based on 100% unload rate of…...1970 BPH
120°F
140°F
160°F
Moisture
% Unload
Rate
Dry
Time
Capacity
Dry BPH
% Unload
Rate
Dry
Time
Capacity
Dry BPH
% Unload
Rate
Dry
Time
Capacity
Dry BPH
%
In
%
Out
11
9
25
36
496
32
28
638
40
23
780
12
9
19
48
374
24
37
481
30
30
588
13
9
15
59
305
20
46
392
24
37
479
14
9
13
69
259
17
54
333
21
44
407
15
9
11
80
225
15
62
290
18
51
354
16
9
10
90
199
13
70
255
16
57
312
17
9
9
102
176
12
79
227
14
65
277
18
9
8
114
157
10
89
202
13
73
247
19
9
7
128
141
9
99
181
11
81
221
Drying table based on 100% unload rate of…...1970 BPH