Drying time table…… 0l, Drying time table – Grain Systems PNEG-1650 User Manual
Page 80
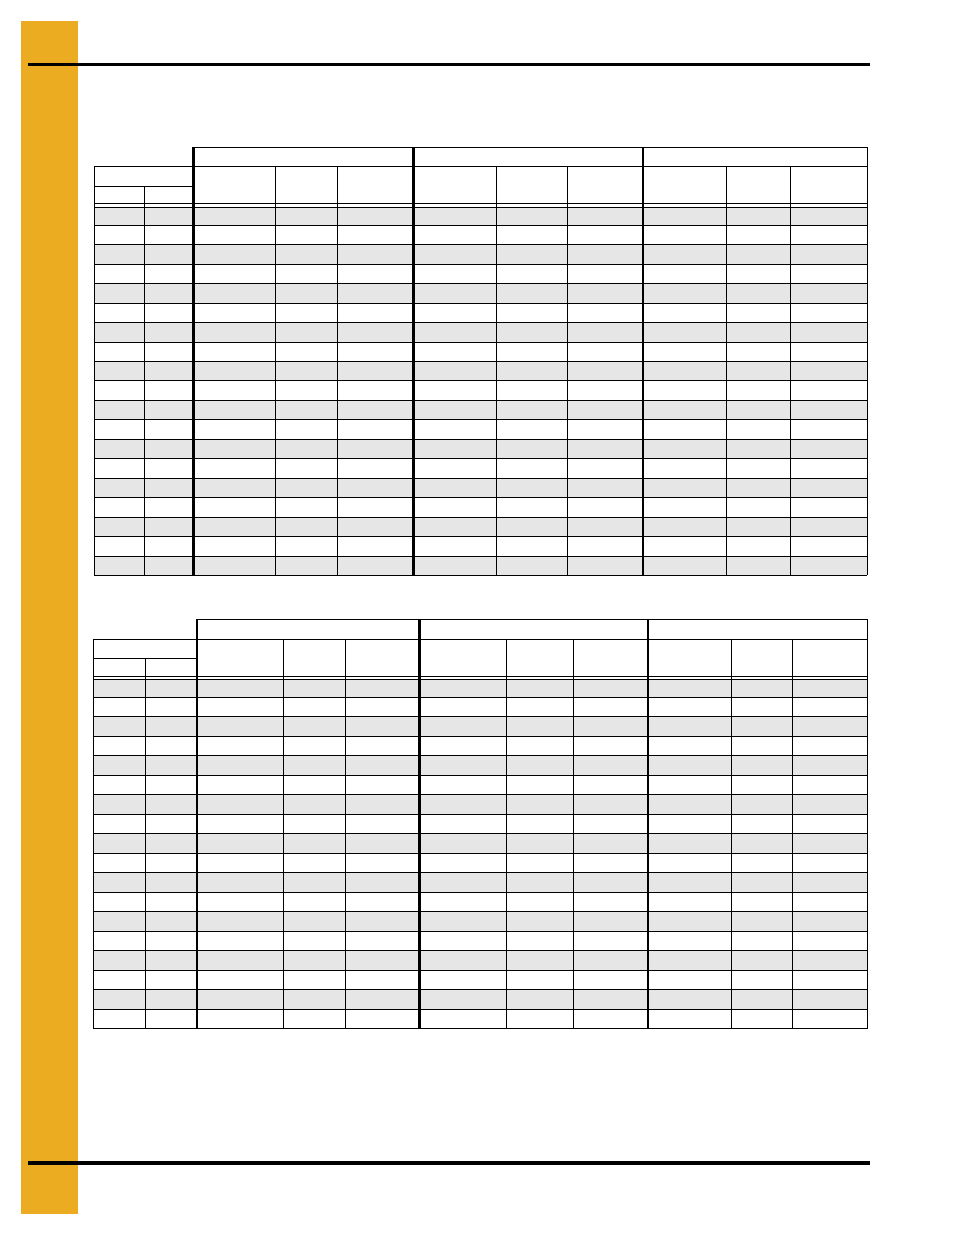
1. Drying Time Table
80
PNEG-1650 GSI Portable Drying Charts
Drying Time Table……..3020L
Corn...Dry and Cool
Corn...Full Heat
The above drying capacities are estimates based on drying principles, field results and computer
simulations. Variances may occur due to grain physiological factors (kernel size, chemical composition,
variety, maturity), excessive fines, weather conditions, etc.
190°F
210°F
230°F
Moisture
% Unload
Rate
Dry
Time
Capacity
Dry BPH
% Unload
Rate
Dry
Time
Capacity
Dry BPH
% Unload
Rate
Dry Time
Capacity
Dry BPH
% In
% Out
17
15
33
20
940
38
17
1074
18
15
25
26
708
29
23
809
19
15
21
32
577
23
28
660
26
25
742
20
15
17
38
490
20
33
561
22
29
631
21
15
15
43
426
17
38
487
19
34
548
22
15
13
49
376
15
43
429
17
38
483
23
15
12
55
334
14
48
381
15
43
429
24
15
11
62
297
12
54
340
14
48
382
25
15
9
69
266
11
61
304
12
54
342
26
15
8
77
239
10
68
273
11
60
307
27
15
8
86
214
9
75
245
10
67
276
28
15
7
95
193
8
83
221
9
74
248
29
15
6
106
174
7
92
199
8
82
224
30
15
6
116
158
6
102
181
7
91
203
31
15
5
128
144
6
112
164
7
99
185
32
15
5
140
132
5
122
150
6
109
169
33
15
4
152
121
5
133
138
6
118
156
34
15
4
165
112
5
144
128
5
128
144
35
15
4
177
104
4
155
119
5
138
134
190°F
210°F
230°F
Moisture
% Unload
Rate
Dry
Time
Capacity
Dry BPH
% Unload
Rate
Dry
Time
Capacity
Dry BPH
% Unload
Rate
Dry
Time
Capacity
Dry BPH
% In
% Out*
18
17
104
9
2921
119
8
3339
19
17
62
16
1742
71
14
1991
80
12
2239
20
17
46
21
1294
53
19
1479
59
17
1664
21
17
37
26
1053
43
23
1203
48
20
1353
22
17
32
31
896
36
27
1024
41
24
1152
23
17
28
35
782
32
31
894
36
27
1005
24
17
25
40
691
28
35
789
32
31
888
25
17
22
45
614
25
39
702
28
35
790
26
17
19
50
548
22
44
626
25
39
705
27
17
17
56
490
20
49
560
22
44
630
28
17
16
63
438
18
55
501
20
49
563
29
17
14
70
393
16
61
449
18
55
505
30
17
13
78
353
14
68
403
16
61
454
31
17
11
87
318
13
76
364
15
67
409
32
17
10
96
288
12
84
329
13
75
370
33
17
9
105
262
11
92
299
12
82
337
34
17
9
115
240
10
101
274
11
90
308
35
17
8
125
221
9
109
252
10
97
284
*Represents the target moisture out of the dryer. Expected final moisture in the bin is
…...
15.0%
Drying table based on 100% unload rate of
…...
2814 BPH