Drying time table…… and 1114 (continued), Drying time table – Grain Systems PNEG-1650 User Manual
Page 12
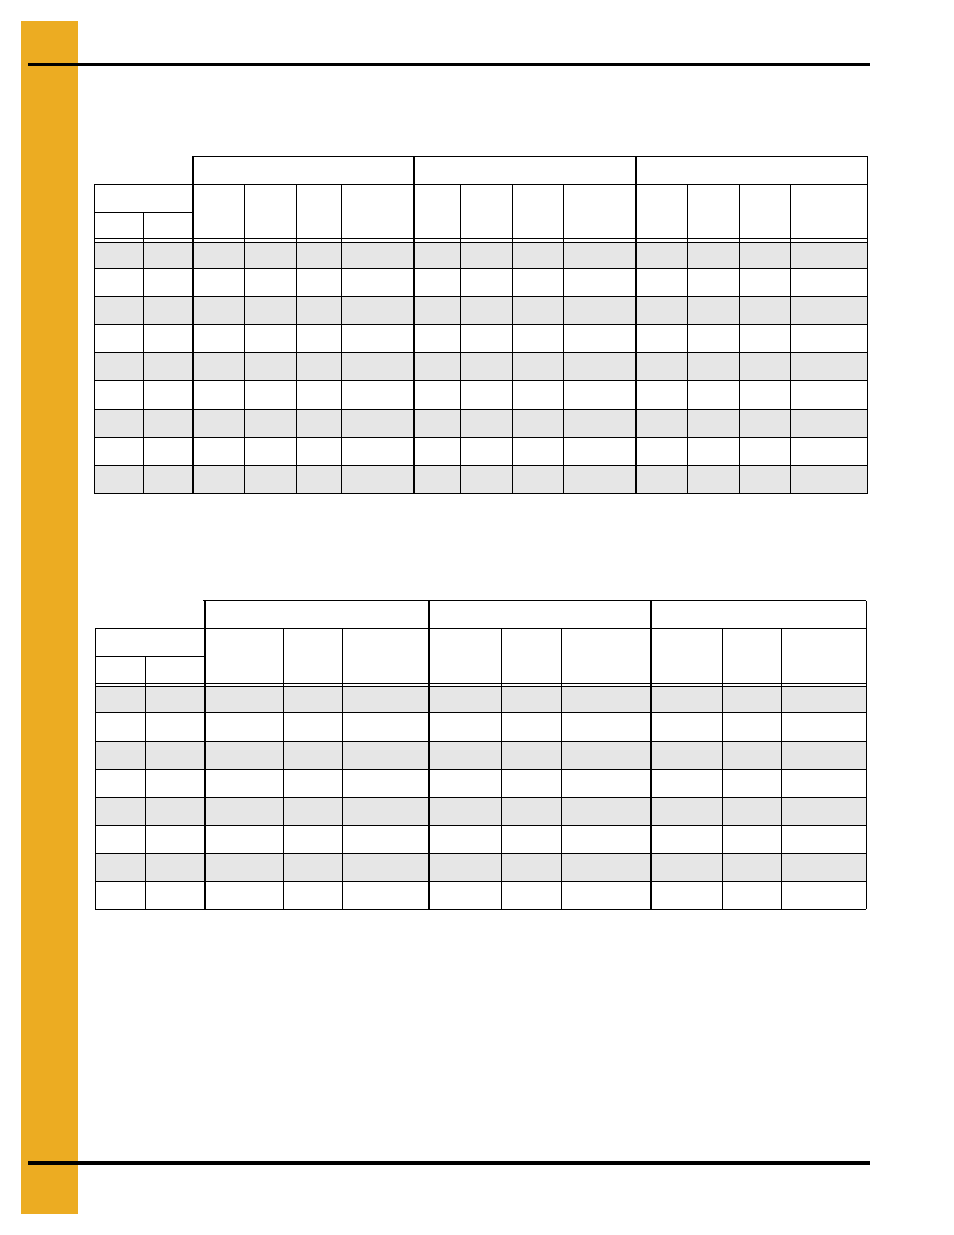
1. Drying Time Table
12
PNEG-1650 GSI Portable Drying Charts
Drying Time Table……..114 and 1114 (Continued)
Soybeans...Dry and Cool (Automatic Batch)
Wheat...Full Heat (Continuous Flow)
The above drying capacities are estimates based on drying principles, field results and computer
simulations. Variances may occur due to grain physiological factors (kernel size, chemical composition,
variety, maturity), excessive fines, weather conditions, etc.
120°F
130°F
140°F
Moisture
Dry
Min.
Time
Hrs
Cool
Min.
Capacity
Dry BPH
Dry
Min.
Time
Hrs
Cool
Min.
Capacity
Dry BPH
Dry
Min.
Time
Hrs
Cool
Min.
Capacity
Dry BPH
% In % Out
15
13
28
0.47
15
340
25
0.41
15
364
16
13
38
0.63
15
289
33
0.55
15
313
29
0.49
15
334
17
13
46
0.77
15
254
40
0.67
15
277
36
0.60
15
297
18
13
54
0.91
15
228
48
0.79
15
249
42
0.71
15
269
19
13
63
1.04
15
206
55
0.91
15
227
49
0.81
15
246
20
13
71
1.18
15
188
62
1.04
15
207
55
0.92
15
225
21
13
80
1.33
15
172
70
1.17
15
190
62
1.04
15
207
22
13
90
1.50
15
157
79
1.31
15
175
70
1.16
15
191
23
13
100
1.67
15
144
88
1.46
15
160
78
1.30
15
175
Drying table based on 100% meter roll speed of…...1970 BPH
Unload timer set for…...9.1 minutes
140°F
155°F
175°F
Moisture
% Unload
Rate
Dry
Time
Capacity
Dry BPH
% Unload
Rate
Dry
Time
Capacity
Dry BPH
% Unload
Rate
Dry
Time
Capacity
Dry BPH
% In
% Out*
15
14
35
26
696
41
22
812
16
14
27
34
524
31
29
612
37
25
728
17
14
22
42
427
25
36
499
30
30
594
18
14
18
50
363
22
42
424
26
36
504
19
14
16
57
316
19
49
368
22
41
439
20
14
14
65
278
16
55
325
20
47
386
21
14
13
73
247
15
62
288
17
52
343
22
14
11
82
220
13
70
257
16
59
306
*Represents the target moisture out of the dryer. Expected final moisture in the bin is…...13.0%
Drying table based on 100% meter roll speed of…...1970 BPH