Drying time table…… and 1126 (continued), Drying time table – Grain Systems PNEG-1650 User Manual
Page 27
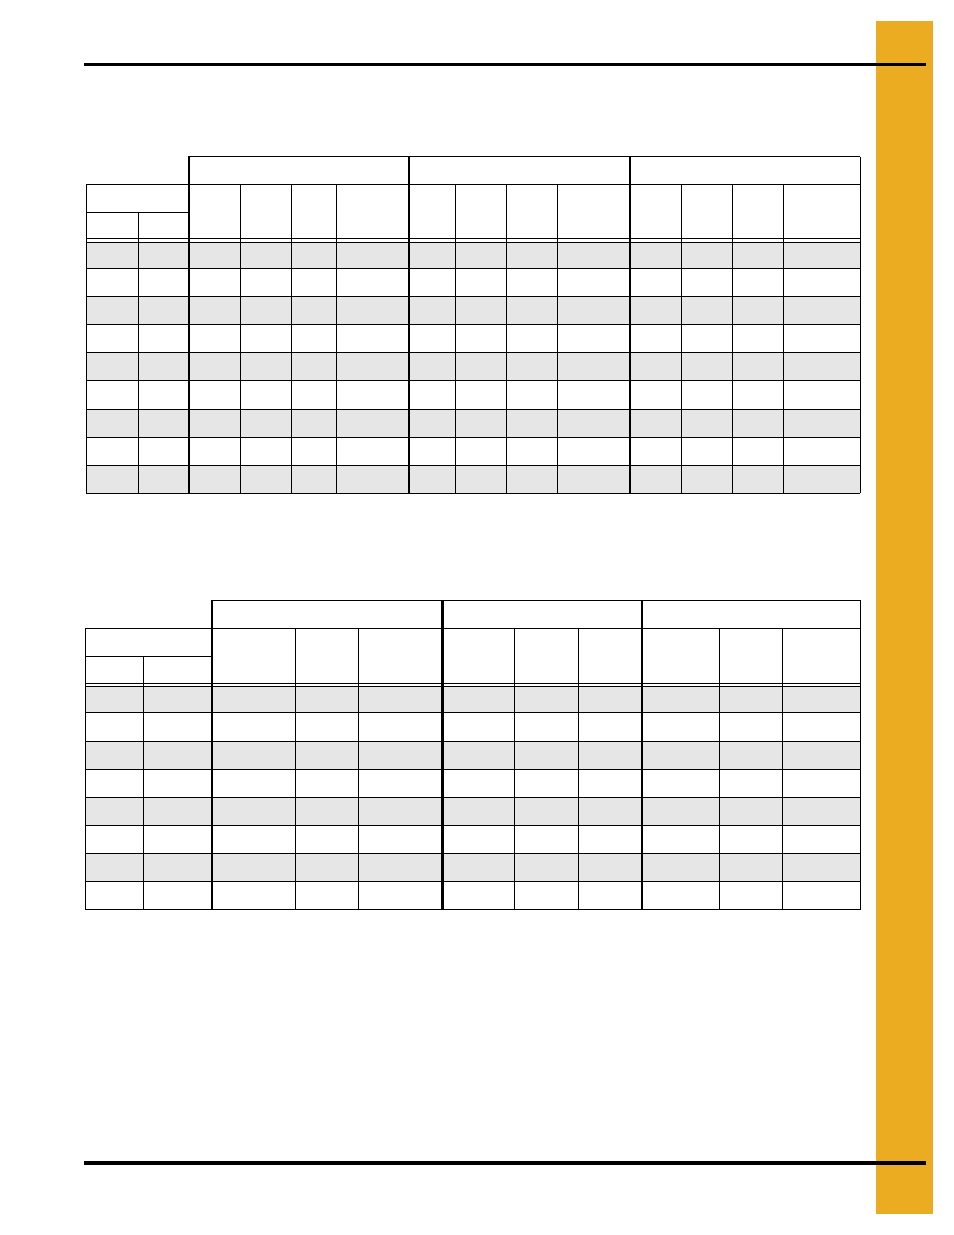
1. Drying Time Table
PNEG-1650 GSI Portable Drying Charts
27
Drying Time Table……..126 and 1126 (Continued)
Soybeans...Dry and Cool (Automatic Batch)
Wheat...Full Heat (Continuous Flow)
The above drying capacities are estimates based on drying principles, field results and computer
simulations. Variances may occur due to grain physiological factors (kernel size, chemical composition,
variety, maturity), excessive fines, weather conditions, etc.
120°F
130°F
140°F
Moisture
Dry
Min.
Time
Hrs
Cool
Min.
Capacity
Dry BPH
Dry
Min.
Time
Hrs
Cool
Min.
Capacity
Dry BPH
Dry
Min.
Time
Hrs
Cool
Min.
Capacity
Dry BPH
% In % Out
15
13
28
0.47
15
673
25
0.41
15
721
16
13
38
0.63
15
573
33
0.55
15
620
29
0.49
15
662
17
13
46
0.77
15
504
40
0.67
15
549
36
0.60
15
589
18
13
54
0.91
15
452
48
0.79
15
495
42
0.71
15
533
19
13
63
1.04
15
410
55
0.91
15
450
49
0.81
15
487
20
13
71
1.18
15
374
62
1.04
15
412
55
0.92
15
447
21
13
80
1.33
15
342
70
1.17
15
378
62
1.04
15
412
22
13
90
1.50
15
313
79
1.31
15
347
70
1.16
15
379
23
13
100
1.67
15
286
88
1.46
15
318
78
1.30
15
348
Drying table based on 100% meter roll speed of…...3658 BPH
Unload timer set for…...9.8 minutes
140°F
155°F
175°F
Moisture
% Unload
Rate
Dry
Time
Capacity
Dry BPH
% Unload
Rate
Dry
Time
Dry
BPH
% Unload
Rate
Dry
Time
Capacity
Dry BPH
% In
% Out*
15
14
38
26
1387
44
22
1618
16
14
29
34
1045
33
29
1219
40
25
1452
17
14
23
42
852
27
36
994
32
30
1184
18
14
20
50
724
23
42
845
27
36
1005
19
14
17
57
629
20
49
734
24
41
874
20
14
15
65
555
18
55
647
21
47
770
21
14
13
73
492
16
62
574
19
52
684
22
14
12
82
439
14
70
512
17
59
610
*Represents the target moisture out of the dryer. Expected final moisture in the bin is…...13.0%
Drying table based on 100% meter roll speed of…...3658 BPH