Drying time table…… and 1122 (continued), Drying time table – Grain Systems PNEG-1650 User Manual
Page 24
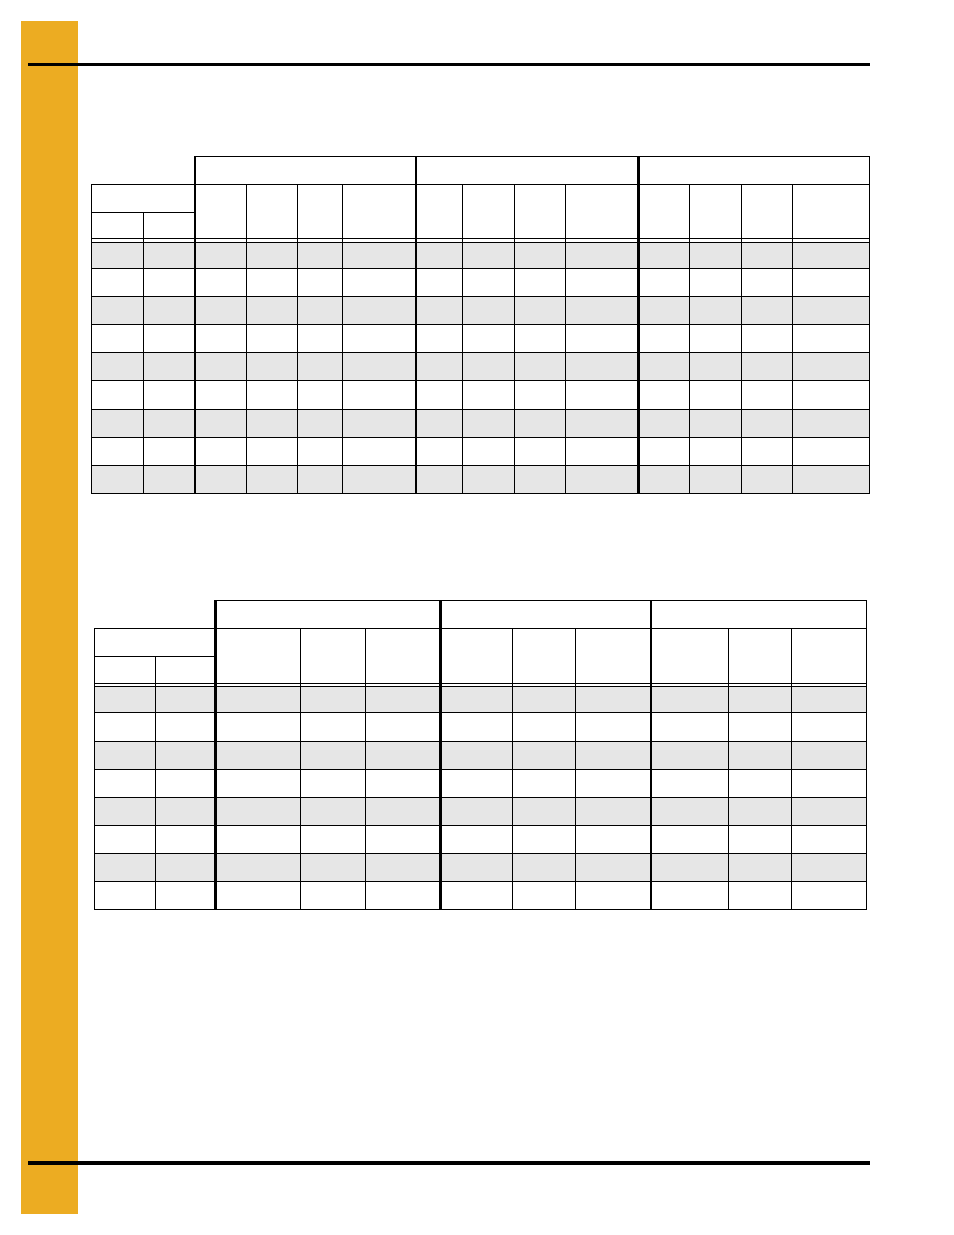
1. Drying Time Table
24
PNEG-1650 GSI Portable Drying Charts
Drying Time Table……..122 and 1122 (Continued)
Soybeans...Dry and Cool (Automatic Batch)
Wheat...Full Heat (Continuous Flow)
The above drying capacities are estimates based on drying principles, field results and computer
simulations. Variances may occur due to grain physiological factors (kernel size, chemical composition,
variety, maturity), excessive fines, weather conditions, etc.
120°F
130°F
140°F
Moisture
Dry
Min.
Time
Hrs
Cool
Min.
Capacity
Dry BPH
Dry
Min.
Time
Hrs
Cool
Min.
Capacity
Dry BPH
Dry
Min.
Time
Hrs
Cool
Min.
Capacity
Dry BPH
% In
% Out
15
13
28
0.47
15
569
25
0.41
15
610
16
13
38
0.63
15
485
33
0.55
15
524
29
0.49
15
560
17
13
46
0.77
15
427
40
0.67
15
464
36
0.60
15
499
18
13
54
0.91
15
383
48
0.79
15
418
42
0.71
15
451
19
13
63
1.04
15
347
55
0.91
15
381
49
0.81
15
412
20
13
71
1.18
15
316
62
1.04
15
349
55
0.92
15
379
21
13
80
1.33
15
289
70
1.17
15
320
62
1.04
15
348
22
13
90
1.50
15
265
79
1.31
15
293
70
1.16
15
320
23
13
100
1.67
15
242
88
1.46
15
269
78
1.30
15
295
Drying table based on 100% meter roll speed of…..3095 BPH
Unload timer set for…...9.8 minutes
140°F
155°F
175°F
Moisture
% Unload
Rate
Dry
Time
Capacity
Dry BPH
% Unload
Rate
Dry
Time
Capacity
Dry BPH
% Unload
Rate
Dry
Time
Capacity
Dry BPH
% In
% Out*
15
14
38
26
1173
44
22
1369
16
14
29
34
884
33
29
1032
40
25
1228
17
14
23
42
721
27
36
841
32
30
1001
18
14
20
50
613
23
42
715
27
36
851
19
14
17
57
533
20
49
621
24
41
740
20
14
15
65
469
18
55
547
21
47
652
21
14
13
73
417
16
62
486
19
52
579
22
14
12
82
372
14
70
433
17
59
516
*Represents the target moisture out of the dryer. Expected final moisture in the bin is…...13.0%
Drying table based on 100% meter roll speed of…...3095 BPH