Drying time table…… 4l, Drying time table – Grain Systems PNEG-1650 User Manual
Page 86
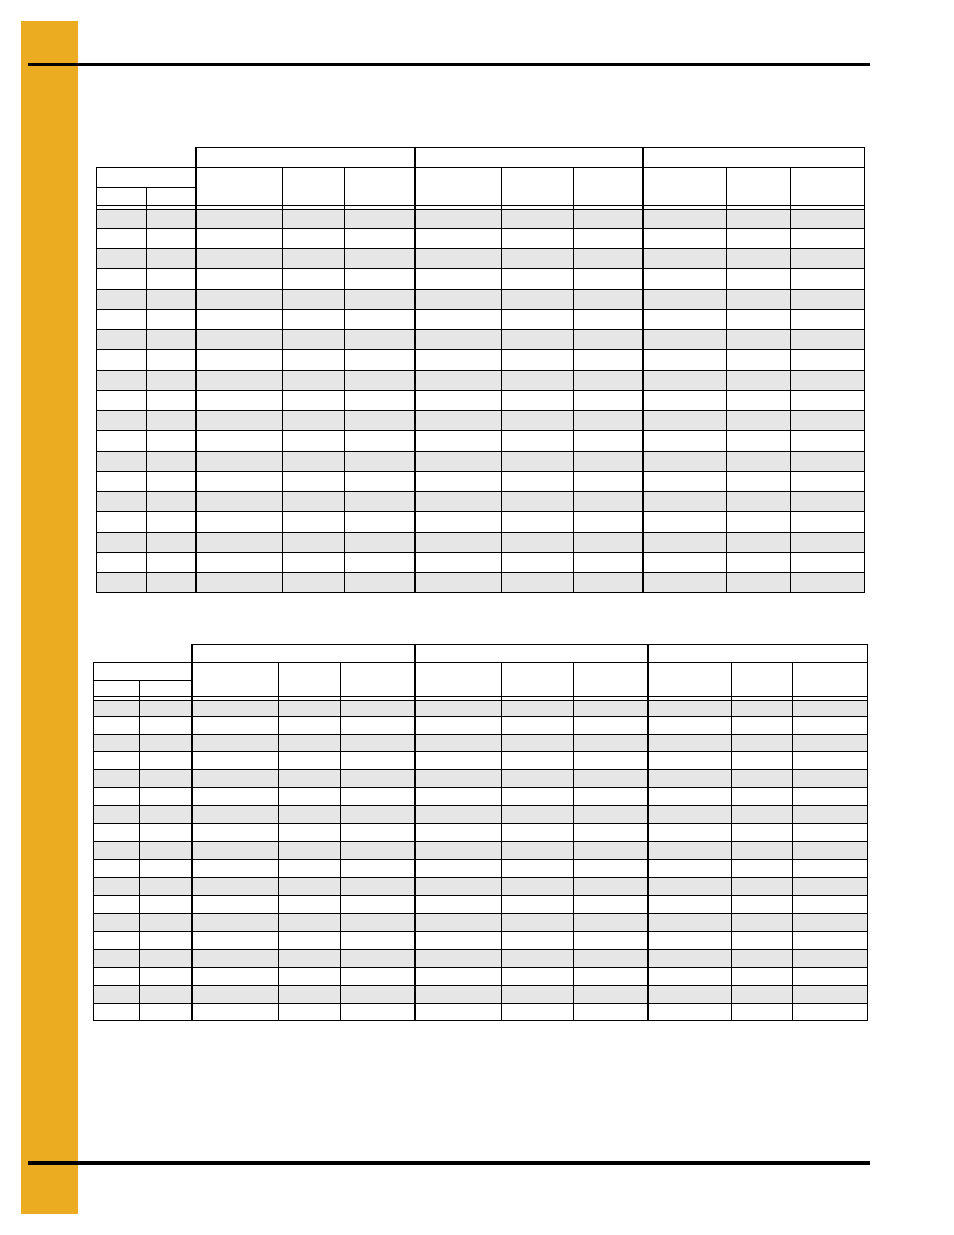
1. Drying Time Table
86
PNEG-1650 GSI Portable Drying Charts
Drying Time Table……..7534L
Corn...Dry and Cool
Corn...Full Heat
The above drying capacities are estimates based on drying principles, field results and computer
simulations. Variances may occur due to grain physiological factors (kernel size, chemical composition,
variety, maturity), excessive fines, weather conditions, etc.
190°F
210°F
230°F
Moisture
% Unload
Rate
Dry
Time
Capacity
Dry BPH
% Unload
Rate
Dry
Time
Capacity
Dry BPH
% Unload
Rate
Dry
Time
Capacity
Dry BPH
% In
% Out
17
15
35
19
1688
40
16
1929
18
15
27
25
1272
30
21
1454
19
15
22
30
1037
25
26
1185
28
23
1333
20
15
18
35
881
21
31
1007
24
28
1133
21
15
16
41
766
18
36
875
21
32
985
22
15
14
46
675
16
41
771
18
36
868
23
15
13
52
599
14
46
685
16
41
770
24
15
11
58
534
13
51
611
14
45
687
25
15
10
65
478
11
57
546
13
51
615
26
15
9
73
428
10
64
490
12
57
551
27
15
8
81
385
9
71
440
10
63
495
28
15
7
90
347
8
79
396
9
70
446
29
15
7
100
313
7
87
358
8
78
403
30
15
6
110
284
7
96
325
8
86
365
31
15
5
121
259
6
106
295
7
94
332
32
15
5
132
236
6
116
270
6
103
304
33
15
5
144
217
5
126
248
6
112
279
34
15
4
156
201
5
136
230
5
121
258
35
15
4
167
187
4
146
213
5
130
240
190°F
210°F
230°F
Moisture
% Unload
Rate
Dry
Time
Capacity
Dry BPH
% Unload
Rate
Dry
Time
Capacity
Dry BPH
% Unload
Rate
Dry
Time
Capacity
Dry BPH
% In
% Out*
18
17
108
9
5188
124
8
5929
19
17
65
15
3093
74
13
3535
83
12
3977
20
17
48
20
2298
55
18
2626
62
16
2954
21
17
39
25
1870
45
22
2137
50
19
2404
22
17
33
29
1592
38
26
1819
43
23
2047
23
17
29
34
1389
33
30
1587
37
26
1785
24
17
26
38
1227
29
33
1402
33
30
1577
25
17
23
43
1091
26
38
1247
29
33
1403
26
17
20
48
973
23
42
1112
26
37
1251
27
17
18
54
870
21
47
994
23
42
1118
28
17
16
60
778
19
53
889
21
47
1001
29
17
15
67
698
17
59
797
19
52
897
30
17
13
75
627
15
65
716
17
58
806
31
17
12
83
565
13
73
646
15
65
726
32
17
11
92
511
12
80
584
14
71
657
33
17
10
101
465
11
88
531
12
78
598
34
17
9
110
425
10
96
486
11
86
547
35
17
8
120
392
9
105
448
11
93
504
*Represents the target moisture out of the dryer. Expected final moisture in the bin is
…...
15.0%
Drying table based on 100% unload rate of
…...
4784 BPH