Drying time table…… 4 (continued), Drying time table – Grain Systems PNEG-1650 User Manual
Page 66
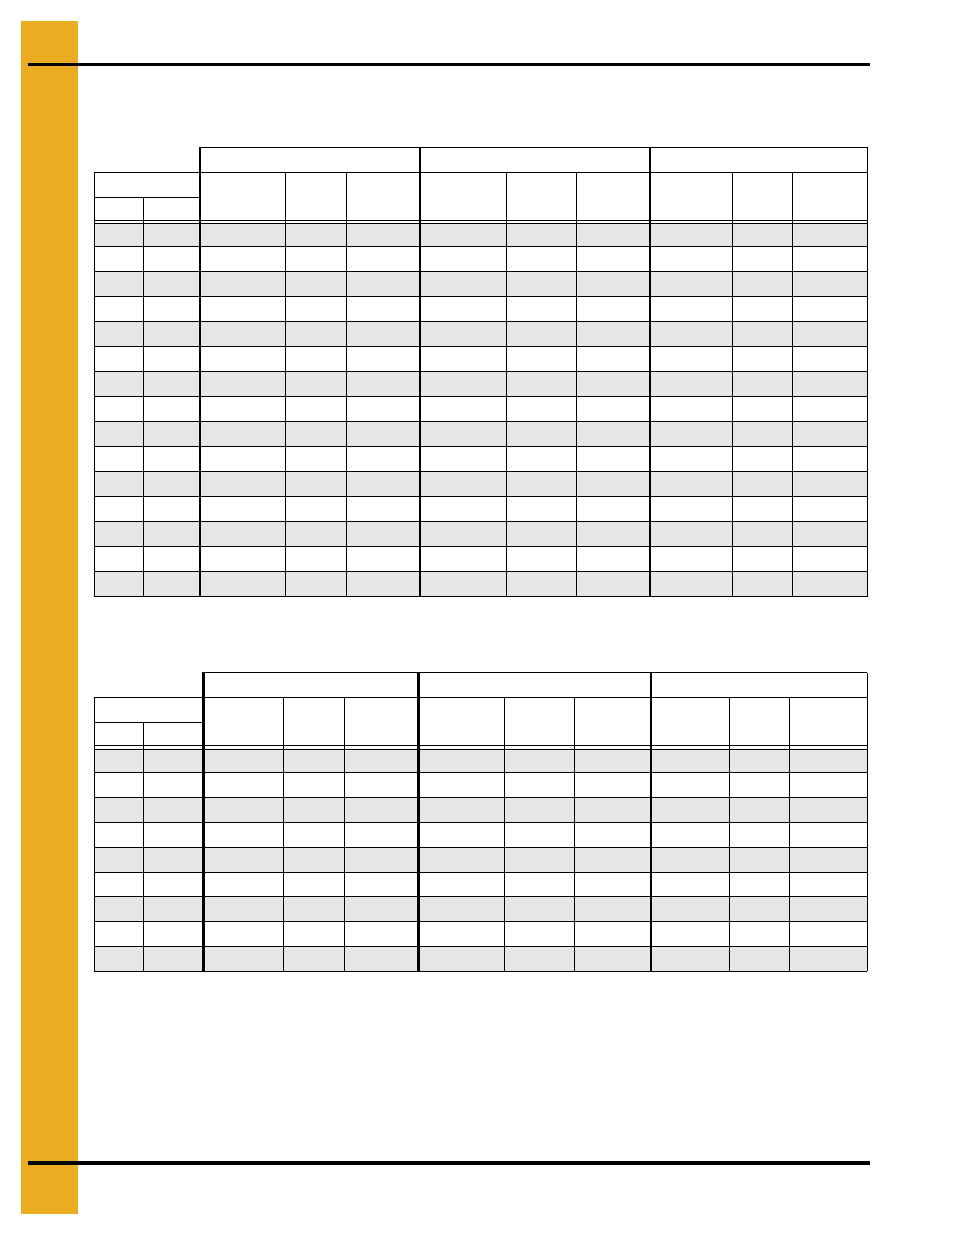
1. Drying Time Table
66
PNEG-1650 GSI Portable Drying Charts
Drying Time Table……..3414 (Continued)
Corn...Full Heat
Wheat, Barley, Milo...Dry and Cool (#1 and #2 Cooling)
The above drying capacities are estimates based on drying principles, field results and computer
simulations. Variances may occur due to grain physiological factors (kernel size, chemical composition,
variety, maturity), excessive fines, weather conditions, etc.
170°F
190°F
210°F
Moisture
% Unload
Rate
Dry
Time
Capacity
Dry BPH
% Unload
Rate
Dry
Time
Capacity
Dry BPH
% Unload
Rate
Dry
Time
Capacity
Dry BPH
%
In
%
Out*
18
17
263
12
5186
307
10
6050
351
9
6915
19
17
157
20
3092
183
17
3607
209
15
4122
20
17
117
27
2297
136
23
2680
155
20
3063
21
17
95
33
1869
111
28
2180
126
25
2492
22
17
81
39
1591
94
33
1856
108
29
2122
23
17
70
44
1388
82
38
1619
94
33
1851
24
17
62
50
1226
73
43
1431
83
38
1635
25
17
55
56
1091
65
48
1272
74
42
1454
26
17
49
63
973
58
54
1135
66
47
1297
27
17
44
71
869
51
60
1014
59
53
1159
28
17
39
79
778
46
68
908
53
59
1037
29
17
35
88
697
41
75
814
47
66
930
30
17
32
98
626
37
84
731
42
73
835
32
17
26
120
511
30
103
596
35
90
681
35
17
20
157
392
23
134
457
27
117
522
*Represents the target moisture out of the dryer. Expected final moisture in the bin is…...15.0%
140°F
155°F
175°F
Moisture
% Unload
Rate
Dry
Time
Capacity
Dry BPH
% Unload
Rate
Dry
Time
Capacity
Dry BPH
% Unload
Rate
Dry
Time
Capacity
Dry BPH
%
In
%
Out
15
13
57
33
1126
67
28
1313
79
24
1563
16
13
43
43
848
50
37
990
60
31
1178
17
13
35
53
692
41
46
807
49
38
961
18
13
30
63
588
35
54
686
41
45
816
19
13
26
72
511
30
62
596
36
52
710
20
13
23
82
450
27
70
525
32
59
625
21
13
20
92
400
24
79
466
28
66
555
23
13
16
115
319
19
99
372
22
83
443
25
13
13
143
257
15
123
300
18
103
357
Drying table based on 100% unload rate of…...1970 BPH