Tektronix CSA8000B User Manual
Page 240
Using Masks, Histograms, and Waveform Databases
3- 166
CSA8000B & TDS8000B User Manual
Overview
Related control elements & resources
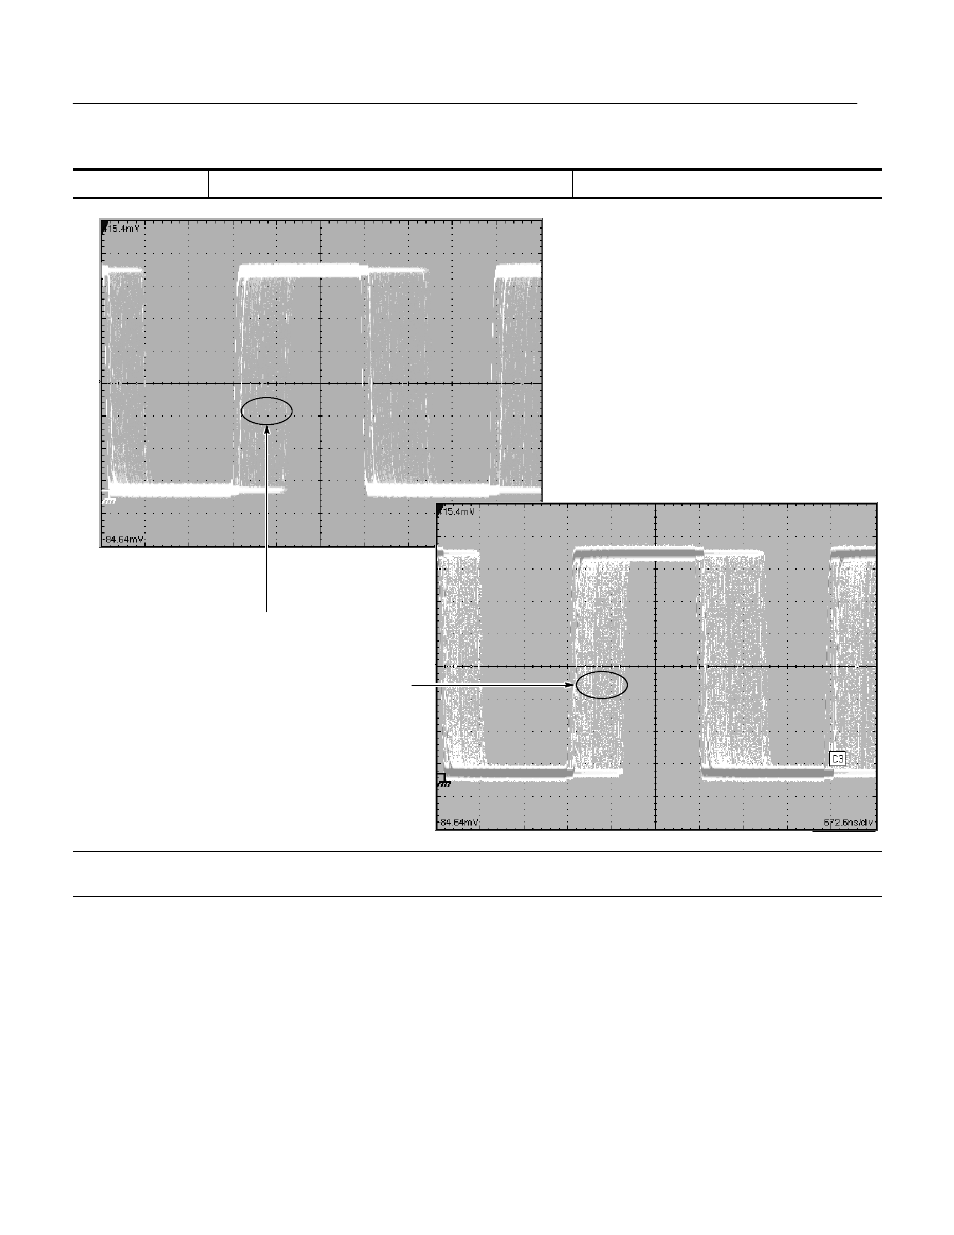
To customize the database display (cont.)
Notice the difference in intensities of the same
data between these two illustrations. In the top
illustration, this portion of data is lighter in
intensity signalling it is least-occurring. In the
illustration to the right, with Invert Color/Intensity
turned on, this data appears much darker,
allowing you to see the data more clearly.
End of Procedure
This manual is related to the following products: