Timex Global Trainer W260 User Manual
Page 10
6
4. Press or q to highlight the field to customize, then press 8 .
5. Press or q to highlight the performance data to select the choice or edit the setting in the field,
then press 8 .
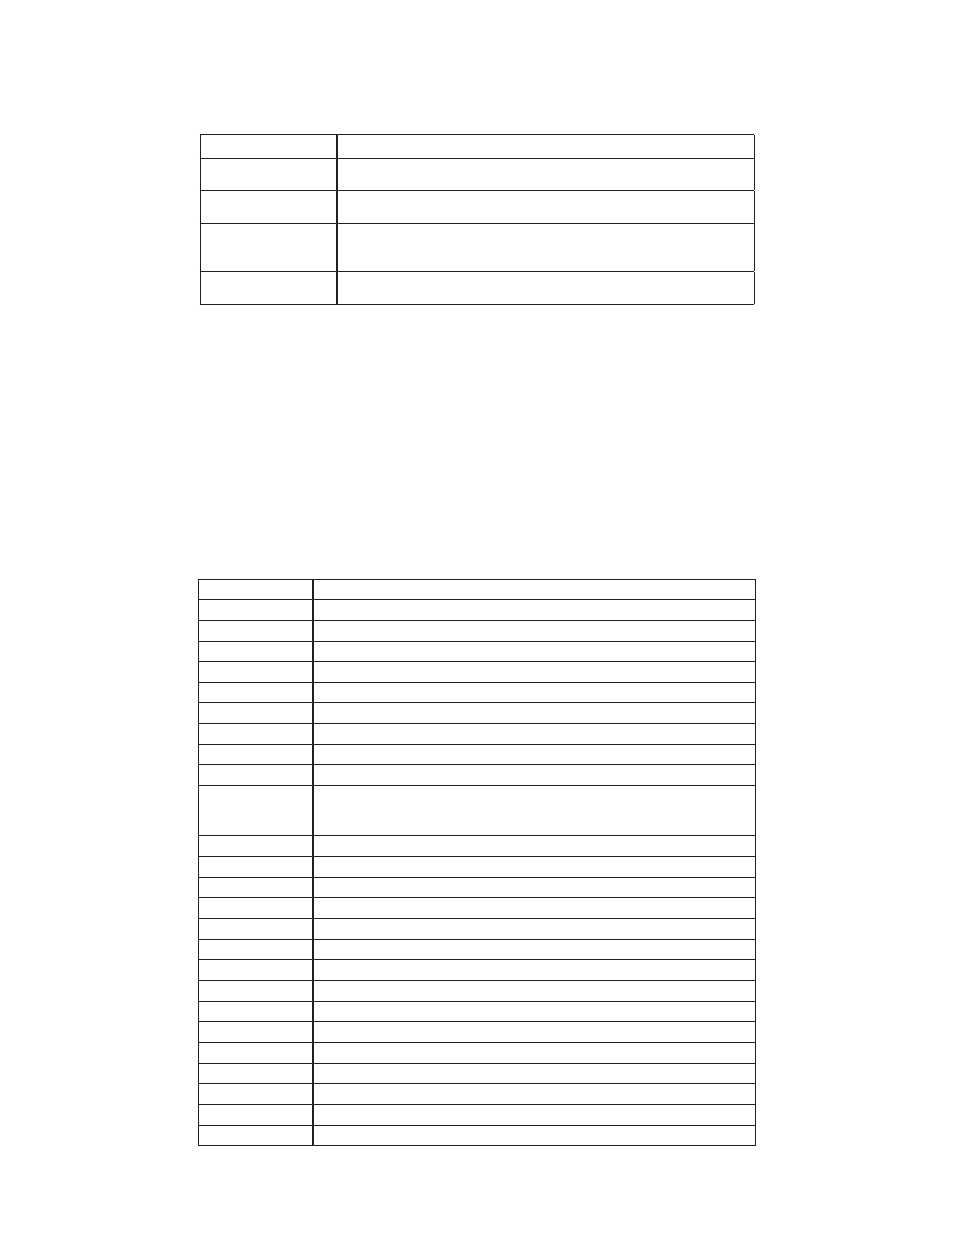
Setting Group
Adjustment
ACTIVITY
Choose the activity to be monitored by this view screen. Choices, in order of
lowest to highest calorie expenditure, are: BIKE, WALK, HIKE, SWIM, RUN.
LEVEL
Choose the level of intensity for this view screen. Choices in order of lowest to
highest calorie expenditure are: VERY SLOW, SLOW, MEDIUM, HIGH, VERY HIGH.
EXTRA WEIGHT
Enter the amount of extra weight carried during this activity. Press
8
to close
the setting change window. More extra weight will result in higher calorie
expenditure.
POWER EFFICIENCY
A scaling factor selectable from 0.18 to 0.25. This value can be configured after
getting metabolic testing with a bike power meter.
Choose the Number of Fields and Select Performance Data
1. Open the Display menu.
2. Press or q to highlight the view screen to customize, then press 8 .
3. Press or q to highlight Field Layout, then press 8 .
4. Press or q to choose the number of fields for the view screen, then press 8 .
5. Press or q to highlight the field to customize, then press 8 .
6. Press or q to highlight the performance data to include in the field, then press 8 .
7. Continue selecting fields and selecting performance data until the view screen contains desired data.
NOTE: Additional data is tracked during your workout beyond the data in the display screens. Review your
workouts in Review Mode to see all tracked data.
Performance data options:
ALTITUDE
your current altitude above sea level
ALTI-INZN
amount of time spent in your defined altitude zone
ALTI-MAX
highest altitude reached during this workout
ALTI-MIN
lowest altitude reached during this workout
ASC-TOTAL
total ascent during this workout
ASC-AVG
average ascent over distance traveled
CADENCE
current RPM of bike crank
CAD-AVG
average RPM of bike crank
CAD-INZN
amount of time spent in your defined cadence zone
CAD-BEST
highest RPM reached during this workout
CALORIES
calories burned
NOTE: To accurately calculate calories burned, configure the view screen using
ACTIVITY SETUP on the Display menu.
DSC-TOTAL
total descent during this workout
DSC-AVG
average descent over distance traveled
DISTANCE
total distance traveled
DIS-LEFT
total distance remaining when tracking back to a waypoint or to a route
HR
current heart rate
HR-AVG
average heart rate over entire workout
HR-PEAK
highest heart rate reached during this workout
HR-INZN
amount of time spent in your defined heart rate zone
PACE
time per mile/km at current speed
PACE-AVG
average time per mile/km over entire workout
PACE-BEST
fastest time per mile/km reached in this workout
PACE-INZN
amount of time spent in your defined pace zone
POWER
current power output
POWER-AVG
average power in watts over entire workout
PWR-INZN
amount of time spent in your defined power zone