Sealey TA090 User Manual
Page 4

8. CURRENT GROUP DATA GRAPHS
9. UM < - > MILS BUTTON
10. GENERAL INFORMATION
Click this button to toggle the units of measurement used on the data graphs.
CURRENT GROUP (CurrentGrp) DATA GRAPHS
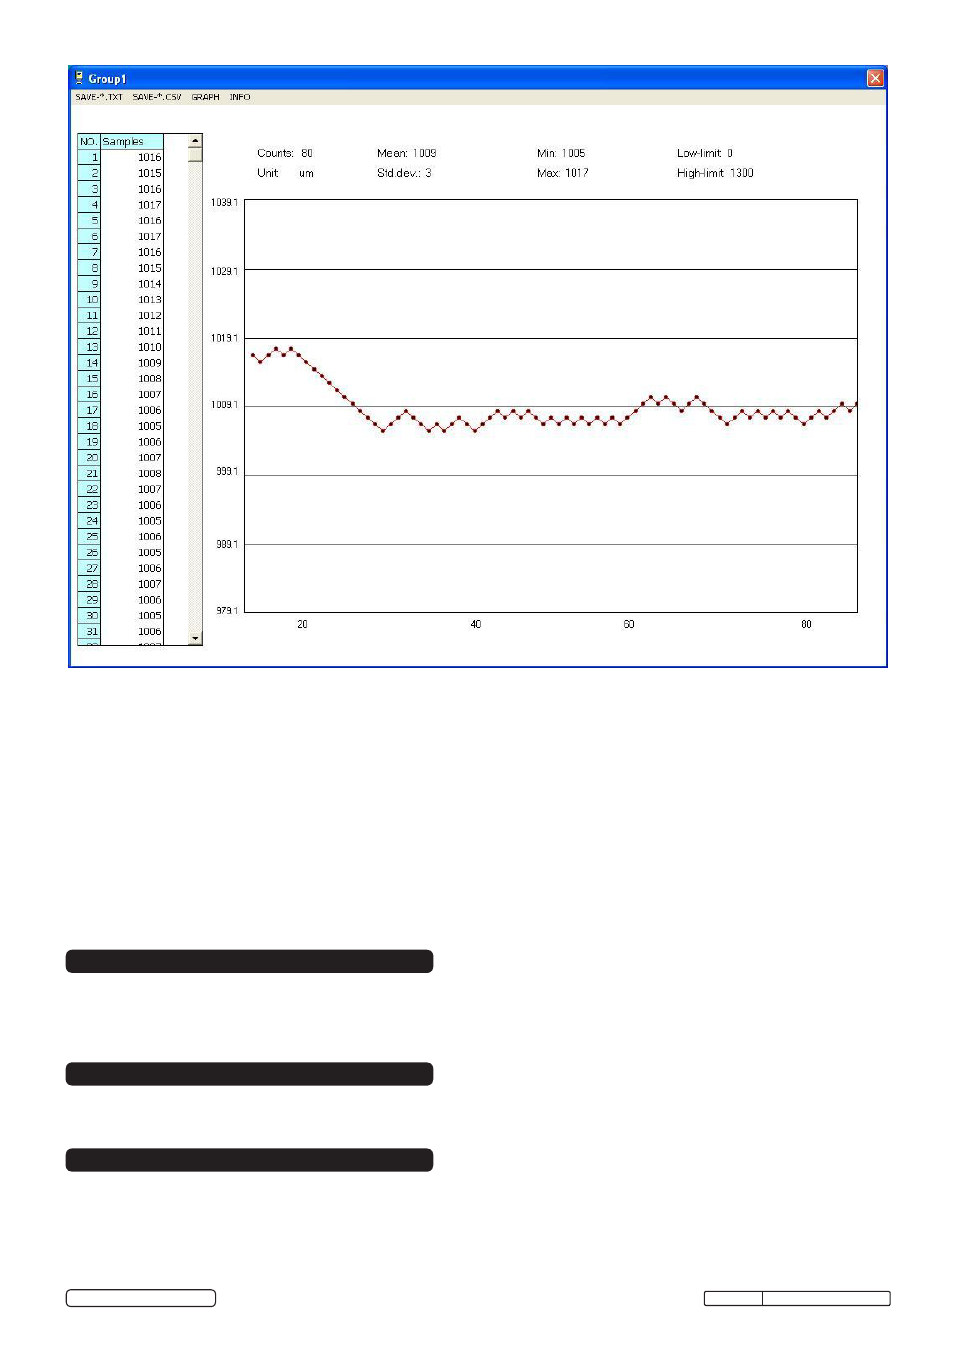
Collect data while the gauge is connected to the PC and then click on CurrentGrp to open the fresh data on an x-y
graph in similar fashion as the standard groups described above.
The INFO menu selection allows the user to access this HELP utility and to view the software’s revision level.
The x-y graph offers the following information in addition to the readings shown directly on the graph:
● Sample number and readings in list form (on the left side of graph)
● Counts (number of samples) and unit of measurement (at the top left of the graph)
● Mean, standard deviation, MIN/MAX statistical data (at the top centre of graph)
● Low/High Alarm limit values (at the top right of the graph)
● Trend or Histogram style graph (selectable from the GRAPH menu)
The TA090 coating thickness gauge works either on the magnetic induction principle or on the eddy
current principle. You can select either probe function via the MENU system. There is also an option
to choose the probe function automatically.
Original Language Version
TA090 Issue No.1 25/10/12
© Jack Sealey Limited
