Sealey TA090 User Manual
Page 3
Original Language Version
TA090 Issue No.1 25/10/12
© Jack Sealey Limited
6. MAIN MENU
7. OPERATION
With the gauge connected to the PC, switch the gauge ON. With the software application
and driver installed, launch the supplied program by double clicking its icon. The screen to
the right will appear. If the CONNECT button is greyed, the gauge is now communicating
with the PC normally. If the CONNECT button is black, click on it to start communication. If
communication is not successful, ensure that the software driver is installed. The driver is
located on the supplied CD-ROM in the driver folder.
The buttons available on the Main Menu are shown on the right and listed below:
● CONNECT: If black, press it to initiate gauge-to-PC communications. If grey,
communication is already active.
● GROUP 1…4: Open one of the four data group x-y graphs .
● ALL_Grps: Opens all four Group graph windows at once.
● CurrentGrp: With the gauge connected to the PC, readings can be taken and shown
on an x-y graph.
● µm < - >mils: Toggle the unit of measurement for the data graphs.
● Exit: Close the program.
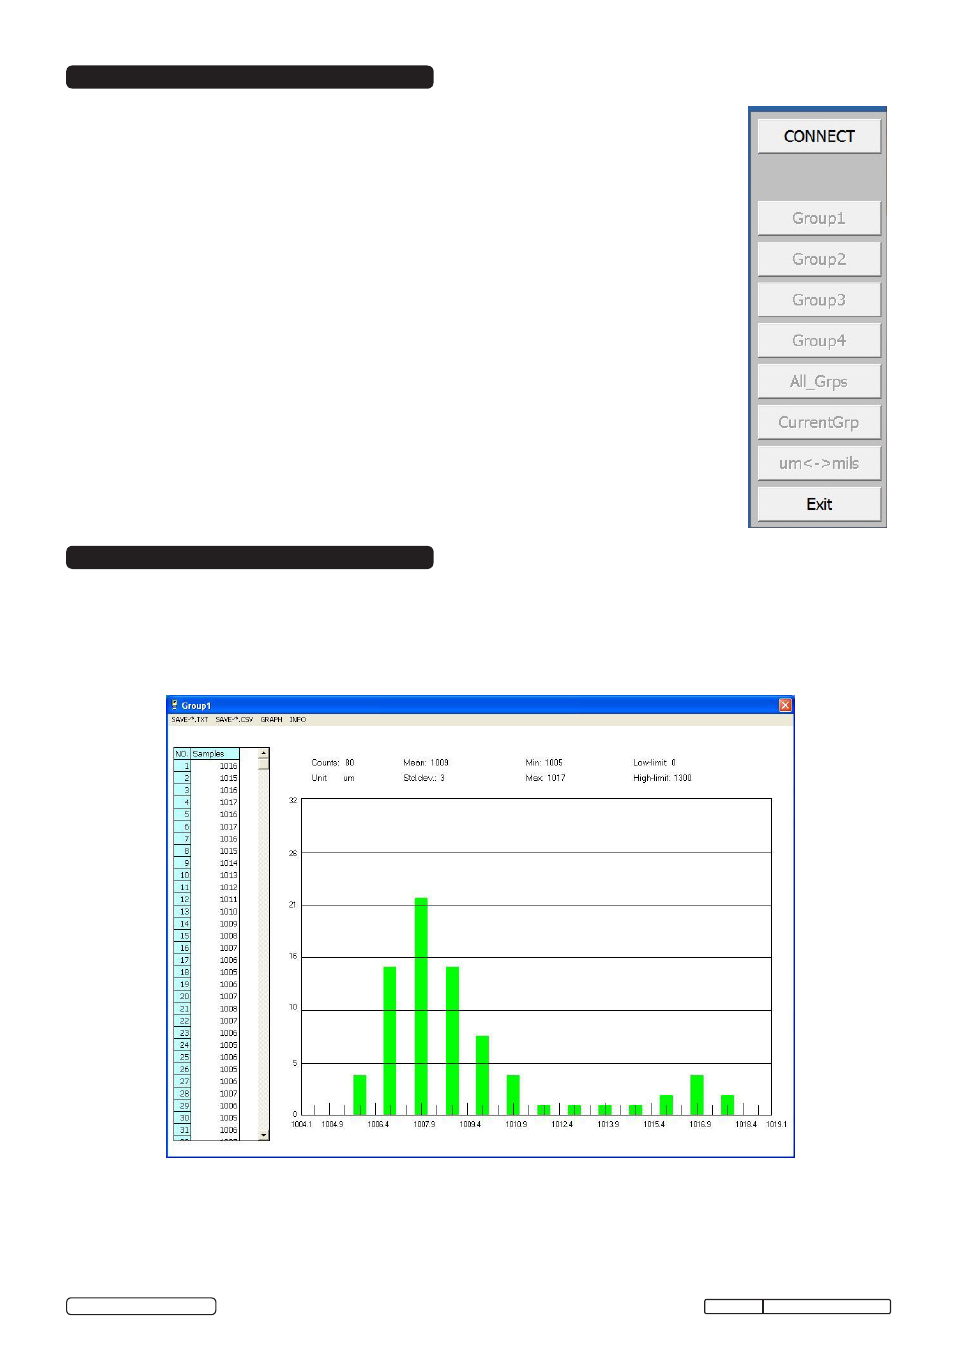
‘GROUP’ DATA GRAPHS
Collect data into one or more of the data groups on the gauge (refer to the gauge's user guide for details on the
GROUP function). After collecting data to a gauge group, click a GROUP button from the MAIN MENU to open an
x-y graph as shown in the diagram below. (Click the ALL_Grps buttons to open all four groups)
The MENU items at the top of the graph window are SAVE *.TXT, SAVE *.CSV, GRAPH, and INFO. The SAVE
items allow the data to be saved as a text file with a TXT or CSV extension for exporting to spreadsheet programs.
The GRAPH selection offers TREND or HISTOGRAM graph styles; a TREND graph is shown on the next page and
a HISTOGRAM above.