Measurement Computing PointScan Road Map rev.2.0 User Manual
Page 30
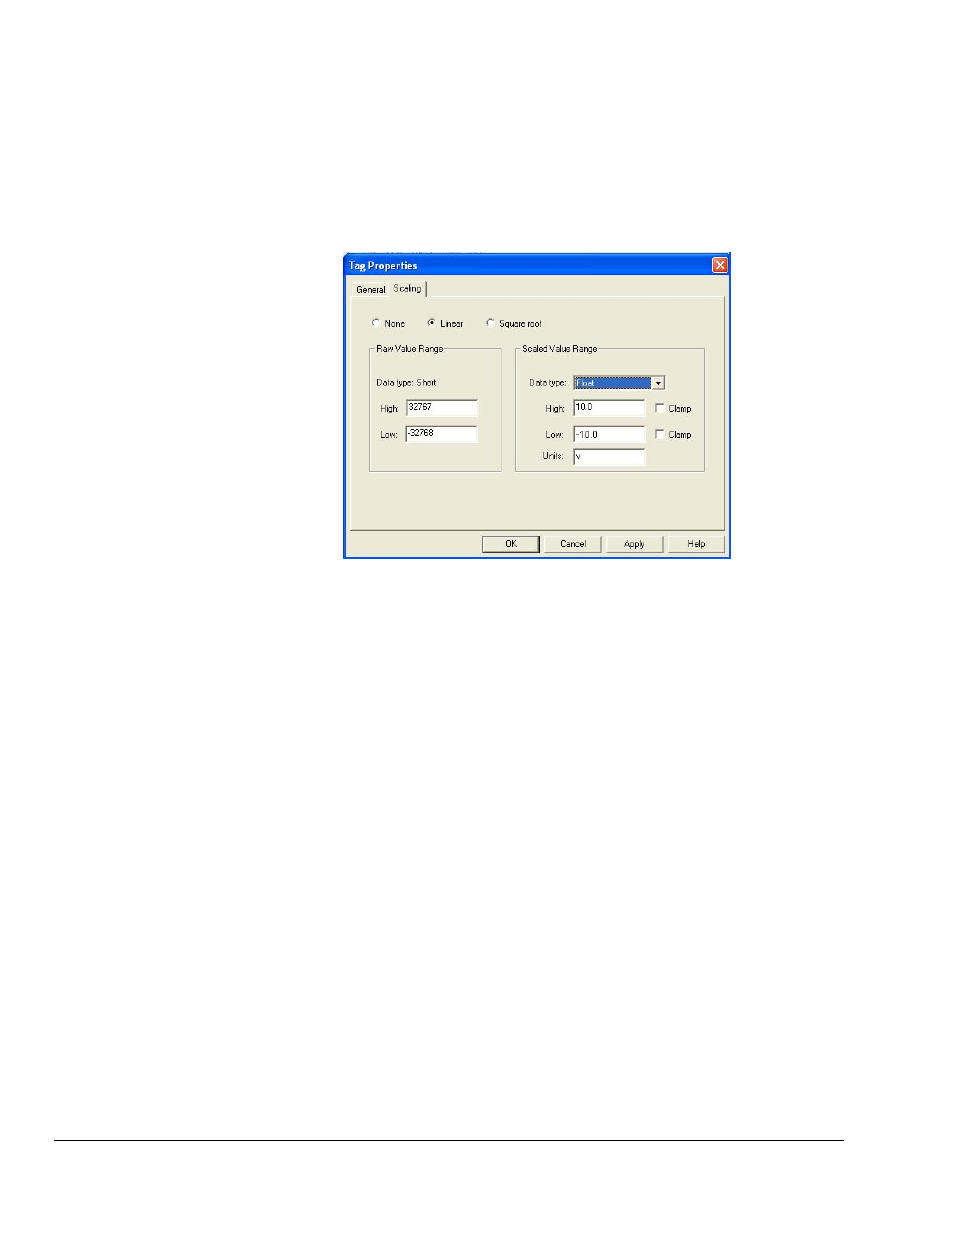
c.1 After you have selected the Scaling tab, select the radio button labeled “Linear.” See
preceding figure.
c.2 Type in the raw value range for the particular channel type you are configuring. You
can find the raw data ranges in the IOToolKit project configured earlier.
Note: The ranges are located in the Scaling tab in the IOToolKit project. The project
is located under the analog or discrete setup screen. IOToolKit’s Scaling tab
shows the raw minimum (Low) and raw maximum (High) values for PointScan
outputs. The same values are to be placed in the Low and High fields under the
KEPServer Scaling tab. This is true for each tag you are configuring.
Tag Properties, Scaling Tab
An example of scaling for voltage.
c.3 Fill in the Scaled Value Range values. Select “Float” as the data type from the pull
down list and then enter the desired minimum (Low) and maximum (High) values that
you would like to apply to the raw data from the PointScan module.
c.4 After you have entered all of the parameters in the General and Scaling windows for
the first tag, click on the
c.5 Enter parameters for additional tags in one of two ways:
Click on the “New” tag icon to save the previous tag information and bring up blank
fields for the next tag.
- or –
Click on the “Duplicate” tag icon to copy the previous tag information for the current
tag, but increment any trailing numeric values by one.
For more information on how to select the tag parameters, click on the
lower right corner of the Tag Properties window.
The values for the Raw
Range (see figure at
right) are obtained from
the IOToolKit project,
which was previously
configured.
26
878395
PointScan Road Map