Casella CEL Microtherm WBGT heat stress monitor User Manual
Page 35
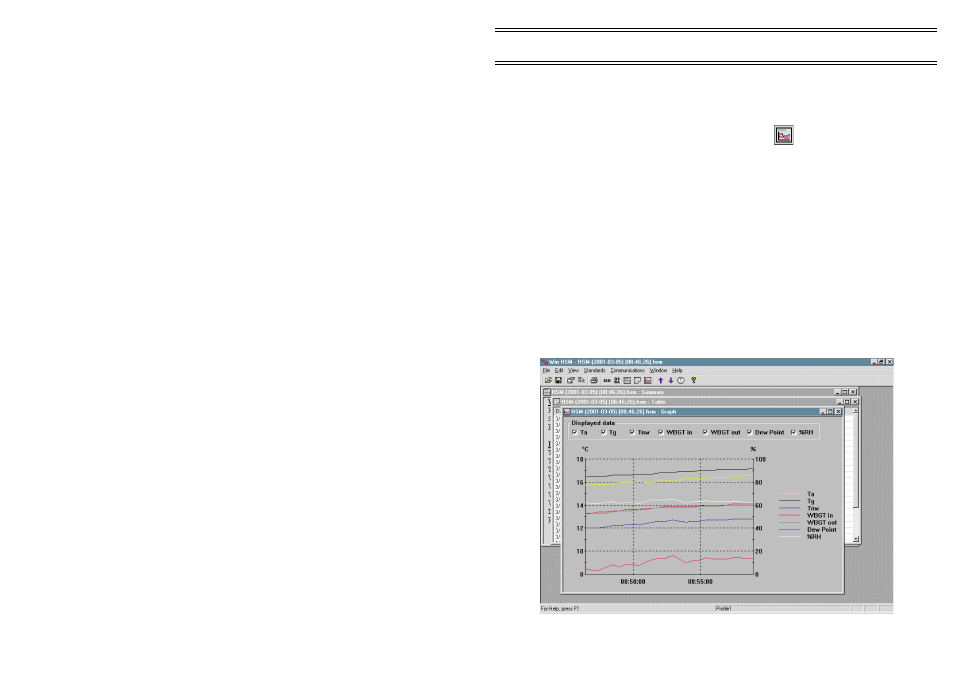
3.5.3 Displaying Data as a Graph
1.
Open the file you want to display as a graph, as described in
Section 3.5.1.
2.
Select
Graph
from the View menu or click
.
The graph will be displayed as shown in Figure 15. Both axes of the
graph are scaled automatically to cover the full range of values
stored and the entire time period contained in the data file. The
different traces are identified by colour.
3.
Tick the relevant boxes (√) to display the required temperature
parameters on the graph.
The graph is redrawn immediately to include the marked parameters.
3.5.4 Exporting Data to Other Applications
WinHSM data files (
.hsm
) can be imported into other applications.
Data files created by WinHSM software are saved as comma delimited ASCII
text. Each set of readings is saved as a single line terminated by a carriage
return/ line feed pair.
Figure 15: Data presented as a graph
Page 35 of 44
Application
Software
MICROTHERM Heat Stress WBGT &
WinHSM Application Software - User Manual