Casio fx-9750G PLUS User Manual
Page 312
284
The following shows the meaning of each item in the case of list data specification.
Data ................ data type
µ ..................... population mean value test conditions (“G µ
0
” specifies two-
tail test, “<
µ
0
” specifies lower one-tail test, “>
µ
0
” specifies
upper one-tail test.)
µ
0
.................... assumed population mean
List .................. list whose contents you want to use as data
Freq ................ frequency
Execute .......... executes a calculation or draws a graph
The following shows the meaning of parameter data specification items that are
different from list data specification.
o
..................... sample mean
x
σ
n
-1
................ sample standard deviation (
x
σ
n
-1
> 0)
n
..................... sample size (positive integer)
Example
To perform a 1-Sample
t
Test for one list of data
For this example, we will perform a
µ G
G
G
G
G
µ
0
test for the data
List1 = {11.2, 10.9, 12.5, 11.3, 11.7}, when
µ
0
= 11.3.
1
(List)c
1
(G)c
bb.dw
1
(List1)c1(1)c
1
(CALC)
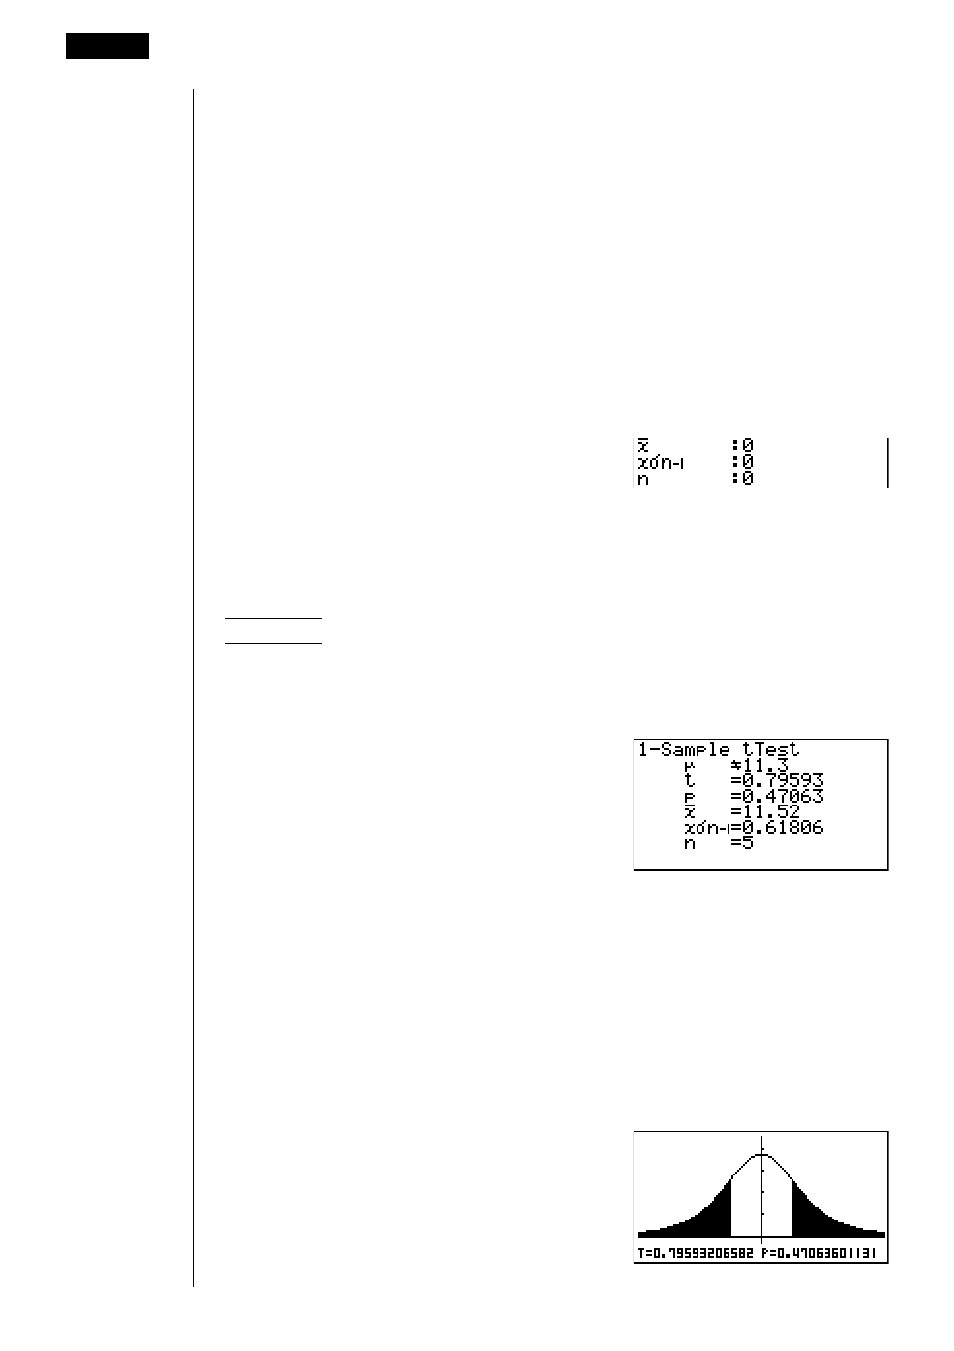
µ G 11.3 .......... assumed population mean and direction of test
t
......................
t
value
p
..................... p-value
o
..................... sample mean
x
σ
n
-1
................ sample standard deviation
n
..................... sample size
The following key operations can be used to draw a graph.
J
ccccc
6
(DRAW)
18 - 6
Tests
- CFX-9850G PLUS CFX-9850GB PLUS CFX-9850GC PLUS CFX-9950GB PLUS CFX-9970G Numerical Calculations CFX-9970G Basic Operation CFX-9970G Complex Numbers CFX-9970G Equation Calculations CFX-9970G Graph Solve CFX-9970G Matrix Calculations CFX-9970G Sketch Function CFX-9970G Graph-to-Table CFX-9970G Graphing CFX-9970G Dual Graph CFX-9850GB CFX-9970G Implicit Function Graphs CFX-9970G Dynamic Graph CFX-9970G Table & Graph CFX-9970G Recursion Table and Graph CFX-9970G List Function CFX-9970G Financial Calculations CFX-9970G Data Communications CFX-9970G Program Library CFX-9970G Programming CFX-9970G Statistical Graphs and Calculations CFX-9850G PLUS Getting Acquainted CFX-9850GB PLUS Getting Acquainted CFX-9850GC PLUS Getting Acquainted CFX-9950GB PLUS Getting Acquainted fx-9750G PLUS Getting Acquainted CFX-9850G PLUS Basic Operation CFX-9850GB PLUS Basic Operation CFX-9850GC PLUS Basic Operation CFX-9950GB PLUS Basic Operation fx-9750G PLUS Basic Operation CFX-9850G PLUS Manual Calculations CFX-9850GB PLUS Manual Calculations CFX-9850GC PLUS Manual Calculations CFX-9950GB PLUS Manual Calculations fx-9750G PLUS Manual Calculations CFX-9850G PLUS Complex Numbers CFX-9850GB PLUS Complex Numbers CFX-9850GC PLUS Complex Numbers CFX-9950GB PLUS Complex Numbers fx-9750G PLUS Complex Numbers CFX-9850G PLUS Numerical Calculations CFX-9850GB PLUS Numerical Calculations CFX-9850GC PLUS Numerical Calculations CFX-9950GB PLUS Numerical Calculations fx-9750G PLUS Numerical Calculations CFX-9850G PLUS Binary, Octal, Decimal, and Hexadecimal Calculations CFX-9850GB PLUS Binary, Octal, Decimal, and Hexadecimal Calculations CFX-9850GC PLUS Binary, Octal, Decimal, and Hexadecimal Calculations CFX-9950GB PLUS Binary, Octal, Decimal, and Hexadecimal Calculations fx-9750G PLUS Binary, Octal, Decimal, and Hexadecimal Calculations CFX-9850G PLUS Equation Calculations CFX-9850GB PLUS Equation Calculations CFX-9850GC PLUS Equation Calculations CFX-9950GB PLUS Equation Calculations fx-9750G PLUS Equation Calculations CFX-9850G PLUS Matrix Calculations CFX-9850GB PLUS Matrix Calculations CFX-9850GC PLUS Matrix Calculations CFX-9950GB PLUS Matrix Calculations fx-9750G PLUS Matrix Calculations CFX-9850G PLUS Graph Solve CFX-9850GB PLUS Graph Solve CFX-9850GC PLUS Graph Solve CFX-9950GB PLUS Graph Solve fx-9750G PLUS Graph Solve CFX-9850G PLUS Graphing CFX-9850GB PLUS Graphing CFX-9850GC PLUS Graphing CFX-9950GB PLUS Graphing fx-9750G PLUS Graphing CFX-9850G PLUS Appendix CFX-9850GB PLUS Appendix CFX-9850GC PLUS Appendix CFX-9950GB PLUS Appendix fx-9750G PLUS Appendix CFX-9850G PLUS Graph-to-Table CFX-9850GB PLUS Graph-to-Table CFX-9850GC PLUS Graph-to-Table CFX-9950GB PLUS Graph-to-Table fx-9750G PLUS Graph-to-Table CFX-9850G PLUS Sketch Function CFX-9850GB PLUS Sketch Function CFX-9850GC PLUS Sketch Function CFX-9950GB PLUS Sketch Function fx-9750G PLUS Sketch Function CFX-9850G PLUS Dynamic Graph CFX-9850GB PLUS Dynamic Graph CFX-9850GC PLUS Dynamic Graph CFX-9950GB PLUS Dynamic Graph fx-9750G PLUS Dynamic Graph CFX-9850G PLUS Table & Graph CFX-9850GB PLUS Table & Graph CFX-9850GC PLUS Table & Graph CFX-9950GB PLUS Table & Graph fx-9750G PLUS Table & Graph CFX-9850G PLUS Implicit Function Graphs CFX-9850GB PLUS Implicit Function Graphs CFX-9850GC PLUS Implicit Function Graphs CFX-9950GB PLUS Implicit Function Graphs fx-9750G PLUS Implicit Function Graphs CFX-9850G PLUS Recursion Table and Graph CFX-9850GB PLUS Recursion Table and Graph CFX-9850GC PLUS Recursion Table and Graph CFX-9950GB PLUS Recursion Table and Graph fx-9750G PLUS Recursion Table and Graph CFX-9850G PLUS List Function CFX-9850GB PLUS List Function CFX-9850GC PLUS List Function CFX-9950GB PLUS List Function fx-9750G PLUS List Function CFX-9850G PLUS Financial Calculations CFX-9850GB PLUS Financial Calculations CFX-9850GC PLUS Financial Calculations CFX-9950GB PLUS Financial Calculations fx-9750G PLUS Financial Calculations CFX-9850G PLUS Data Communications CFX-9850GB PLUS Data Communications CFX-9850GC PLUS Data Communications CFX-9950GB PLUS Data Communications fx-9750G PLUS Data Communications CFX-9850G PLUS Programming CFX-9850GB PLUS Programming CFX-9850GC PLUS Programming CFX-9950GB PLUS Programming fx-9750G PLUS Programming CFX-9850G PLUS Program Library CFX-9850GB PLUS Program Library CFX-9850GC PLUS Program Library CFX-9950GB PLUS Program Library fx-9750G PLUS Program Library CFX-9850G PLUS Statistical Graphs and Calculations CFX-9850GB PLUS Statistical Graphs and Calculations CFX-9850GC PLUS Statistical Graphs and Calculations CFX-9950GB PLUS Statistical Graphs and Calculations fx-9750G PLUS Statistical Graphs and Calculations fx-9750G Graph Solve fx-9750G Dual Graph fx-9750G Graph-to-Table fx-9750G Data Communications fx-7400G PLUS Data Communications fx-9750G Program Library fx-7400G Program Library fx-7400G PLUS Program Library fx-9750G Financial Calculations fx-7400G Programming fx-7400G PLUS Programming