Casio fx-9750G PLUS User Manual
Page 282
254
u
u
u
u
u
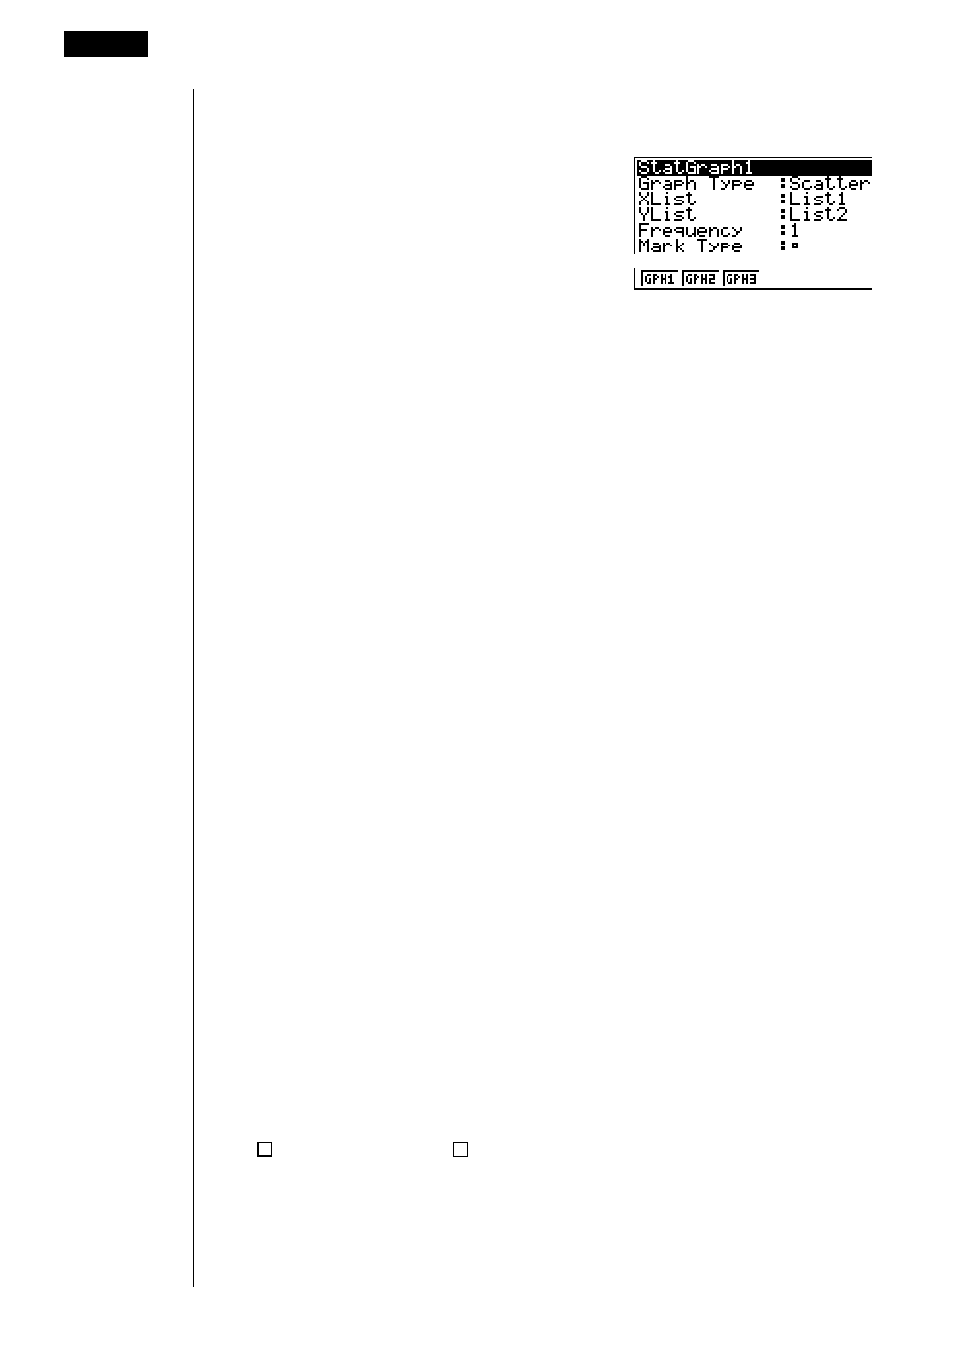
To display the general graph settings screen
[GRPH]-[SET]
Pressing 6 (SET) displays the general graph settings screen.
• The settings shown here are examples only. The settings on your general graph
settings screen may differ.
u
u
u
u
u
StatGraph (statistical graph specification)
• {
GPH1}/{GPH2}/{GPH3} ... graph {1}/{2}/{3}
u
u
u
u
u
Graph Type (graph type specification)
• {
Scat}/{
xy
}
/{NPP} ... {scatter diagram}/{
xy
line graph}/{normal probability plot}
–––
• {
Hist}/{Box}/{Box}/{N·Dis}/{Brkn} ... {histogram}/{med-box graph}/{mean-box
graph}/{normal distribution curve}/{broken line graph}
• {
X}/{Med}/{X^2}/{X^3}/{X^4} ... {linear regression graph}/{Med-Med graph}/
{quadratic regression graph}/{cubic regression graph}/{quartic regression
graph}
• {
Log}/{Exp}/{Pwr}/{Sin}/{Lgst} ... {logarithmic regression graph}/{exponential
regression graph}/{power regression graph}/{sine regression graph}/
{logistic regression graph}
u
u
u
u
u
XList (x-axis data list)
• {
List1}/{List2}/{List3}/{List4}/{List5}/{List6} ... {List 1}/{List 2}/{List 3}/{List 4}/
{List 5}/{List 6}
u
u
u
u
u
YList (y-axis data list)
• {
List1}/{List2}/{List3}/{List4}/{List5}/{List6} ... {List 1}/{List 2}/{List 3}/{List 4}/
{List 5}/{List 6}
u
u
u
u
u
Frequency (number of data items)
• {
1} ... {1-to-1 plot}
• {
List1}/{List2}/{List3}/{List4}/{List5}/{List6} ... frequency data in {List 1}/
{List 2}/{List 3}/{List 4}/{List 5}/{List 6}
u
u
u
u
u
Mark Type (plot mark type)
• { }
/{
×}/{•} ... plot points: { }/{×}/{•}
18 - 2
Paired-Variable Statistical Calculation Examples
- CFX-9850G PLUS CFX-9850GB PLUS CFX-9850GC PLUS CFX-9950GB PLUS CFX-9970G Numerical Calculations CFX-9970G Basic Operation CFX-9970G Complex Numbers CFX-9970G Equation Calculations CFX-9970G Graph Solve CFX-9970G Matrix Calculations CFX-9970G Sketch Function CFX-9970G Graph-to-Table CFX-9970G Graphing CFX-9970G Dual Graph CFX-9850GB CFX-9970G Implicit Function Graphs CFX-9970G Dynamic Graph CFX-9970G Table & Graph CFX-9970G Recursion Table and Graph CFX-9970G List Function CFX-9970G Financial Calculations CFX-9970G Data Communications CFX-9970G Program Library CFX-9970G Programming CFX-9970G Statistical Graphs and Calculations CFX-9850G PLUS Getting Acquainted CFX-9850GB PLUS Getting Acquainted CFX-9850GC PLUS Getting Acquainted CFX-9950GB PLUS Getting Acquainted fx-9750G PLUS Getting Acquainted CFX-9850G PLUS Basic Operation CFX-9850GB PLUS Basic Operation CFX-9850GC PLUS Basic Operation CFX-9950GB PLUS Basic Operation fx-9750G PLUS Basic Operation CFX-9850G PLUS Manual Calculations CFX-9850GB PLUS Manual Calculations CFX-9850GC PLUS Manual Calculations CFX-9950GB PLUS Manual Calculations fx-9750G PLUS Manual Calculations CFX-9850G PLUS Complex Numbers CFX-9850GB PLUS Complex Numbers CFX-9850GC PLUS Complex Numbers CFX-9950GB PLUS Complex Numbers fx-9750G PLUS Complex Numbers CFX-9850G PLUS Numerical Calculations CFX-9850GB PLUS Numerical Calculations CFX-9850GC PLUS Numerical Calculations CFX-9950GB PLUS Numerical Calculations fx-9750G PLUS Numerical Calculations CFX-9850G PLUS Binary, Octal, Decimal, and Hexadecimal Calculations CFX-9850GB PLUS Binary, Octal, Decimal, and Hexadecimal Calculations CFX-9850GC PLUS Binary, Octal, Decimal, and Hexadecimal Calculations CFX-9950GB PLUS Binary, Octal, Decimal, and Hexadecimal Calculations fx-9750G PLUS Binary, Octal, Decimal, and Hexadecimal Calculations CFX-9850G PLUS Equation Calculations CFX-9850GB PLUS Equation Calculations CFX-9850GC PLUS Equation Calculations CFX-9950GB PLUS Equation Calculations fx-9750G PLUS Equation Calculations CFX-9850G PLUS Matrix Calculations CFX-9850GB PLUS Matrix Calculations CFX-9850GC PLUS Matrix Calculations CFX-9950GB PLUS Matrix Calculations fx-9750G PLUS Matrix Calculations CFX-9850G PLUS Graph Solve CFX-9850GB PLUS Graph Solve CFX-9850GC PLUS Graph Solve CFX-9950GB PLUS Graph Solve fx-9750G PLUS Graph Solve CFX-9850G PLUS Graphing CFX-9850GB PLUS Graphing CFX-9850GC PLUS Graphing CFX-9950GB PLUS Graphing fx-9750G PLUS Graphing CFX-9850G PLUS Appendix CFX-9850GB PLUS Appendix CFX-9850GC PLUS Appendix CFX-9950GB PLUS Appendix fx-9750G PLUS Appendix CFX-9850G PLUS Graph-to-Table CFX-9850GB PLUS Graph-to-Table CFX-9850GC PLUS Graph-to-Table CFX-9950GB PLUS Graph-to-Table fx-9750G PLUS Graph-to-Table CFX-9850G PLUS Sketch Function CFX-9850GB PLUS Sketch Function CFX-9850GC PLUS Sketch Function CFX-9950GB PLUS Sketch Function fx-9750G PLUS Sketch Function CFX-9850G PLUS Dynamic Graph CFX-9850GB PLUS Dynamic Graph CFX-9850GC PLUS Dynamic Graph CFX-9950GB PLUS Dynamic Graph fx-9750G PLUS Dynamic Graph CFX-9850G PLUS Table & Graph CFX-9850GB PLUS Table & Graph CFX-9850GC PLUS Table & Graph CFX-9950GB PLUS Table & Graph fx-9750G PLUS Table & Graph CFX-9850G PLUS Implicit Function Graphs CFX-9850GB PLUS Implicit Function Graphs CFX-9850GC PLUS Implicit Function Graphs CFX-9950GB PLUS Implicit Function Graphs fx-9750G PLUS Implicit Function Graphs CFX-9850G PLUS Recursion Table and Graph CFX-9850GB PLUS Recursion Table and Graph CFX-9850GC PLUS Recursion Table and Graph CFX-9950GB PLUS Recursion Table and Graph fx-9750G PLUS Recursion Table and Graph CFX-9850G PLUS List Function CFX-9850GB PLUS List Function CFX-9850GC PLUS List Function CFX-9950GB PLUS List Function fx-9750G PLUS List Function CFX-9850G PLUS Financial Calculations CFX-9850GB PLUS Financial Calculations CFX-9850GC PLUS Financial Calculations CFX-9950GB PLUS Financial Calculations fx-9750G PLUS Financial Calculations CFX-9850G PLUS Data Communications CFX-9850GB PLUS Data Communications CFX-9850GC PLUS Data Communications CFX-9950GB PLUS Data Communications fx-9750G PLUS Data Communications CFX-9850G PLUS Programming CFX-9850GB PLUS Programming CFX-9850GC PLUS Programming CFX-9950GB PLUS Programming fx-9750G PLUS Programming CFX-9850G PLUS Program Library CFX-9850GB PLUS Program Library CFX-9850GC PLUS Program Library CFX-9950GB PLUS Program Library fx-9750G PLUS Program Library CFX-9850G PLUS Statistical Graphs and Calculations CFX-9850GB PLUS Statistical Graphs and Calculations CFX-9850GC PLUS Statistical Graphs and Calculations CFX-9950GB PLUS Statistical Graphs and Calculations fx-9750G PLUS Statistical Graphs and Calculations fx-9750G Graph Solve fx-9750G Dual Graph fx-9750G Graph-to-Table fx-9750G Data Communications fx-7400G PLUS Data Communications fx-9750G Program Library fx-7400G Program Library fx-7400G PLUS Program Library fx-9750G Financial Calculations fx-7400G Programming fx-7400G PLUS Programming