Casio fx-9750G PLUS User Manual
Page 223
195
14-2 Graphing a Conic Section
Example 1 To graph the circle (X – 1)
2
+ (Y – 1)
2
= 2
2
Use the following View Window parameters.
Xmin = –6.3
Ymin = –3.1
Xmax = 6.3
Ymax = 3.1
Xscale = 1
Yscale = 1
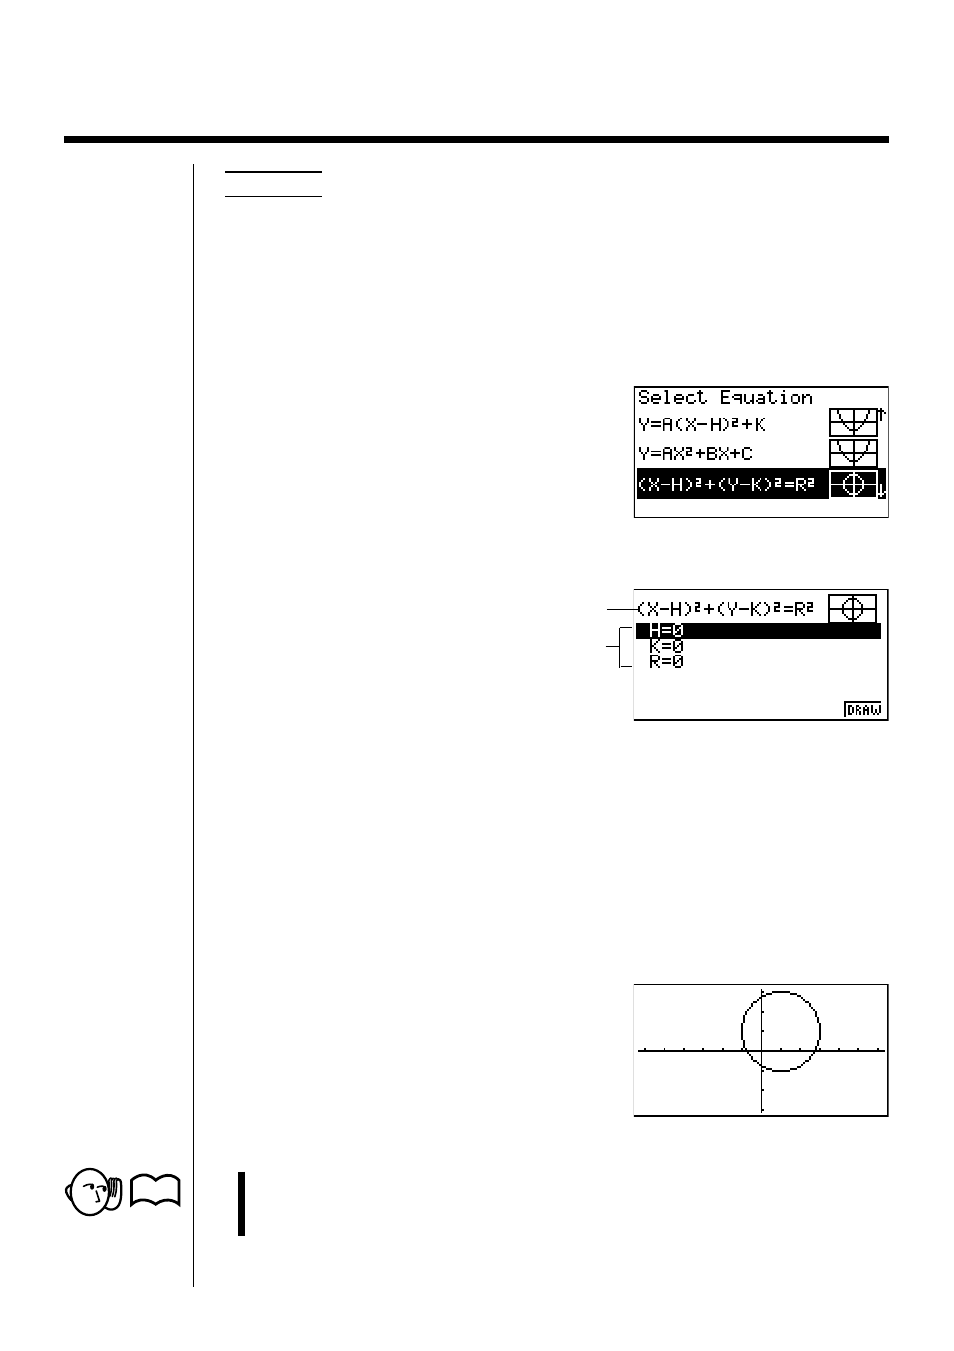
1. Select the function whose graph you want to draw.
cccc
2. Press w and the variable input screen appears.
• The values that appear are the values currently assigned to each variable,
which are general variables used by the calculator. If the values include an
imaginary part, only the real part appears on the display.
3. Assign values to each variable.
bwbwcw
• You can also use f and c to highlight a variable and then input a value.
4. Press 6 (DRAW) to draw the graph.
• Certain View Window parameters can make a circle graph come out looking
like an ellipse. When this happens, you can use the graph correction function
(SQR) to make corrections and produce a perfect circle.
Graph function
Function variables
P.136
- CFX-9850G PLUS CFX-9850GB PLUS CFX-9850GC PLUS CFX-9950GB PLUS CFX-9970G Numerical Calculations CFX-9970G Basic Operation CFX-9970G Complex Numbers CFX-9970G Equation Calculations CFX-9970G Graph Solve CFX-9970G Matrix Calculations CFX-9970G Sketch Function CFX-9970G Graph-to-Table CFX-9970G Graphing CFX-9970G Dual Graph CFX-9850GB CFX-9970G Implicit Function Graphs CFX-9970G Dynamic Graph CFX-9970G Table & Graph CFX-9970G Recursion Table and Graph CFX-9970G List Function CFX-9970G Financial Calculations CFX-9970G Data Communications CFX-9970G Program Library CFX-9970G Programming CFX-9970G Statistical Graphs and Calculations CFX-9850G PLUS Getting Acquainted CFX-9850GB PLUS Getting Acquainted CFX-9850GC PLUS Getting Acquainted CFX-9950GB PLUS Getting Acquainted fx-9750G PLUS Getting Acquainted CFX-9850G PLUS Basic Operation CFX-9850GB PLUS Basic Operation CFX-9850GC PLUS Basic Operation CFX-9950GB PLUS Basic Operation fx-9750G PLUS Basic Operation CFX-9850G PLUS Manual Calculations CFX-9850GB PLUS Manual Calculations CFX-9850GC PLUS Manual Calculations CFX-9950GB PLUS Manual Calculations fx-9750G PLUS Manual Calculations CFX-9850G PLUS Complex Numbers CFX-9850GB PLUS Complex Numbers CFX-9850GC PLUS Complex Numbers CFX-9950GB PLUS Complex Numbers fx-9750G PLUS Complex Numbers CFX-9850G PLUS Numerical Calculations CFX-9850GB PLUS Numerical Calculations CFX-9850GC PLUS Numerical Calculations CFX-9950GB PLUS Numerical Calculations fx-9750G PLUS Numerical Calculations CFX-9850G PLUS Binary, Octal, Decimal, and Hexadecimal Calculations CFX-9850GB PLUS Binary, Octal, Decimal, and Hexadecimal Calculations CFX-9850GC PLUS Binary, Octal, Decimal, and Hexadecimal Calculations CFX-9950GB PLUS Binary, Octal, Decimal, and Hexadecimal Calculations fx-9750G PLUS Binary, Octal, Decimal, and Hexadecimal Calculations CFX-9850G PLUS Equation Calculations CFX-9850GB PLUS Equation Calculations CFX-9850GC PLUS Equation Calculations CFX-9950GB PLUS Equation Calculations fx-9750G PLUS Equation Calculations CFX-9850G PLUS Matrix Calculations CFX-9850GB PLUS Matrix Calculations CFX-9850GC PLUS Matrix Calculations CFX-9950GB PLUS Matrix Calculations fx-9750G PLUS Matrix Calculations CFX-9850G PLUS Graph Solve CFX-9850GB PLUS Graph Solve CFX-9850GC PLUS Graph Solve CFX-9950GB PLUS Graph Solve fx-9750G PLUS Graph Solve CFX-9850G PLUS Graphing CFX-9850GB PLUS Graphing CFX-9850GC PLUS Graphing CFX-9950GB PLUS Graphing fx-9750G PLUS Graphing CFX-9850G PLUS Appendix CFX-9850GB PLUS Appendix CFX-9850GC PLUS Appendix CFX-9950GB PLUS Appendix fx-9750G PLUS Appendix CFX-9850G PLUS Graph-to-Table CFX-9850GB PLUS Graph-to-Table CFX-9850GC PLUS Graph-to-Table CFX-9950GB PLUS Graph-to-Table fx-9750G PLUS Graph-to-Table CFX-9850G PLUS Sketch Function CFX-9850GB PLUS Sketch Function CFX-9850GC PLUS Sketch Function CFX-9950GB PLUS Sketch Function fx-9750G PLUS Sketch Function CFX-9850G PLUS Dynamic Graph CFX-9850GB PLUS Dynamic Graph CFX-9850GC PLUS Dynamic Graph CFX-9950GB PLUS Dynamic Graph fx-9750G PLUS Dynamic Graph CFX-9850G PLUS Table & Graph CFX-9850GB PLUS Table & Graph CFX-9850GC PLUS Table & Graph CFX-9950GB PLUS Table & Graph fx-9750G PLUS Table & Graph CFX-9850G PLUS Implicit Function Graphs CFX-9850GB PLUS Implicit Function Graphs CFX-9850GC PLUS Implicit Function Graphs CFX-9950GB PLUS Implicit Function Graphs fx-9750G PLUS Implicit Function Graphs CFX-9850G PLUS Recursion Table and Graph CFX-9850GB PLUS Recursion Table and Graph CFX-9850GC PLUS Recursion Table and Graph CFX-9950GB PLUS Recursion Table and Graph fx-9750G PLUS Recursion Table and Graph CFX-9850G PLUS List Function CFX-9850GB PLUS List Function CFX-9850GC PLUS List Function CFX-9950GB PLUS List Function fx-9750G PLUS List Function CFX-9850G PLUS Financial Calculations CFX-9850GB PLUS Financial Calculations CFX-9850GC PLUS Financial Calculations CFX-9950GB PLUS Financial Calculations fx-9750G PLUS Financial Calculations CFX-9850G PLUS Data Communications CFX-9850GB PLUS Data Communications CFX-9850GC PLUS Data Communications CFX-9950GB PLUS Data Communications fx-9750G PLUS Data Communications CFX-9850G PLUS Programming CFX-9850GB PLUS Programming CFX-9850GC PLUS Programming CFX-9950GB PLUS Programming fx-9750G PLUS Programming CFX-9850G PLUS Program Library CFX-9850GB PLUS Program Library CFX-9850GC PLUS Program Library CFX-9950GB PLUS Program Library fx-9750G PLUS Program Library CFX-9850G PLUS Statistical Graphs and Calculations CFX-9850GB PLUS Statistical Graphs and Calculations CFX-9850GC PLUS Statistical Graphs and Calculations CFX-9950GB PLUS Statistical Graphs and Calculations fx-9750G PLUS Statistical Graphs and Calculations fx-9750G Graph Solve fx-9750G Dual Graph fx-9750G Graph-to-Table fx-9750G Data Communications fx-7400G PLUS Data Communications fx-9750G Program Library fx-7400G Program Library fx-7400G PLUS Program Library fx-9750G Financial Calculations fx-7400G Programming fx-7400G PLUS Programming