Casio fx-9750G PLUS User Manual
Page 149
121
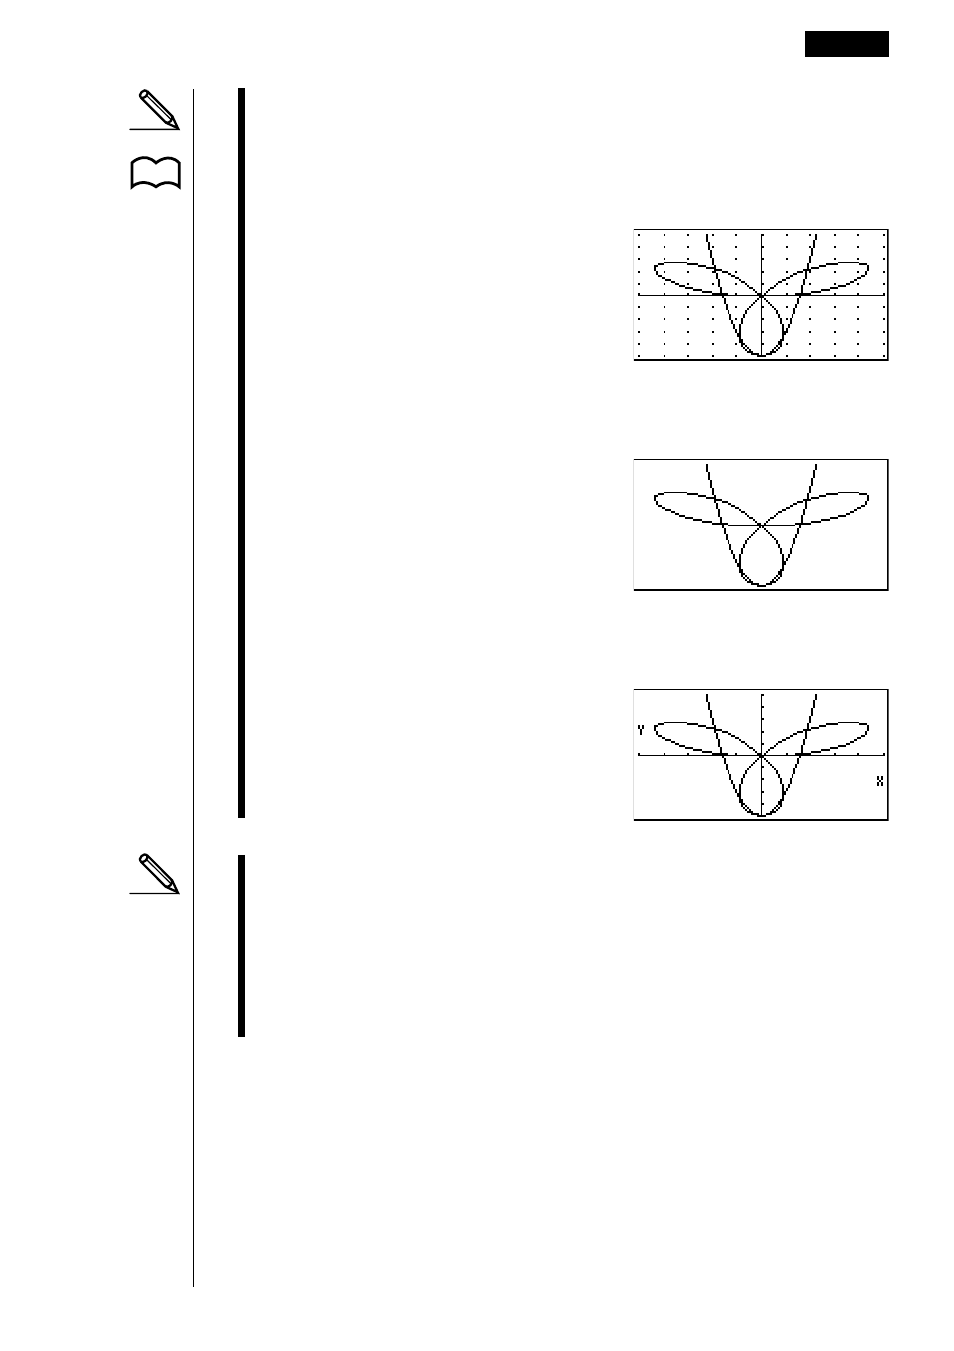
• You can use the set up screen settings to alter the appearance of the graph
screen as shown below.
• Grid: On (Axes: On Label: Off)
This setting causes dots to appear at the grid intersects on the display.
• Axes: Off (Label: Off Grid: Off)
This setting clears the axis lines from the display.
• Label: On (Axes: On Grid: Off)
This setting displays labels for the
x
- and
y
-axes.
• A polar coordinate (r =) or parametric graph will appear coarse if the settings
you make in the View Window cause the T,
θ pitch value to be too large,
relative to the differential between the T,
θ min and T, θ max settings. If the
settings you make cause the T,
θ pitch value to be too small relative to the
differential between the T,
θ min and T, θ max settings, on the other hand, the
graph will take a very long time to draw.
• Attempting to draw a graph for an expression in which X is input for an X =
constant expression results in an error.
Graph Function Operations
8 - 3
P.6
- CFX-9850G PLUS CFX-9850GB PLUS CFX-9850GC PLUS CFX-9950GB PLUS CFX-9970G Numerical Calculations CFX-9970G Basic Operation CFX-9970G Complex Numbers CFX-9970G Equation Calculations CFX-9970G Graph Solve CFX-9970G Matrix Calculations CFX-9970G Sketch Function CFX-9970G Graph-to-Table CFX-9970G Graphing CFX-9970G Dual Graph CFX-9850GB CFX-9970G Implicit Function Graphs CFX-9970G Dynamic Graph CFX-9970G Table & Graph CFX-9970G Recursion Table and Graph CFX-9970G List Function CFX-9970G Financial Calculations CFX-9970G Data Communications CFX-9970G Program Library CFX-9970G Programming CFX-9970G Statistical Graphs and Calculations CFX-9850G PLUS Getting Acquainted CFX-9850GB PLUS Getting Acquainted CFX-9850GC PLUS Getting Acquainted CFX-9950GB PLUS Getting Acquainted fx-9750G PLUS Getting Acquainted CFX-9850G PLUS Basic Operation CFX-9850GB PLUS Basic Operation CFX-9850GC PLUS Basic Operation CFX-9950GB PLUS Basic Operation fx-9750G PLUS Basic Operation CFX-9850G PLUS Manual Calculations CFX-9850GB PLUS Manual Calculations CFX-9850GC PLUS Manual Calculations CFX-9950GB PLUS Manual Calculations fx-9750G PLUS Manual Calculations CFX-9850G PLUS Complex Numbers CFX-9850GB PLUS Complex Numbers CFX-9850GC PLUS Complex Numbers CFX-9950GB PLUS Complex Numbers fx-9750G PLUS Complex Numbers CFX-9850G PLUS Numerical Calculations CFX-9850GB PLUS Numerical Calculations CFX-9850GC PLUS Numerical Calculations CFX-9950GB PLUS Numerical Calculations fx-9750G PLUS Numerical Calculations CFX-9850G PLUS Binary, Octal, Decimal, and Hexadecimal Calculations CFX-9850GB PLUS Binary, Octal, Decimal, and Hexadecimal Calculations CFX-9850GC PLUS Binary, Octal, Decimal, and Hexadecimal Calculations CFX-9950GB PLUS Binary, Octal, Decimal, and Hexadecimal Calculations fx-9750G PLUS Binary, Octal, Decimal, and Hexadecimal Calculations CFX-9850G PLUS Equation Calculations CFX-9850GB PLUS Equation Calculations CFX-9850GC PLUS Equation Calculations CFX-9950GB PLUS Equation Calculations fx-9750G PLUS Equation Calculations CFX-9850G PLUS Matrix Calculations CFX-9850GB PLUS Matrix Calculations CFX-9850GC PLUS Matrix Calculations CFX-9950GB PLUS Matrix Calculations fx-9750G PLUS Matrix Calculations CFX-9850G PLUS Graph Solve CFX-9850GB PLUS Graph Solve CFX-9850GC PLUS Graph Solve CFX-9950GB PLUS Graph Solve fx-9750G PLUS Graph Solve CFX-9850G PLUS Graphing CFX-9850GB PLUS Graphing CFX-9850GC PLUS Graphing CFX-9950GB PLUS Graphing fx-9750G PLUS Graphing CFX-9850G PLUS Appendix CFX-9850GB PLUS Appendix CFX-9850GC PLUS Appendix CFX-9950GB PLUS Appendix fx-9750G PLUS Appendix CFX-9850G PLUS Graph-to-Table CFX-9850GB PLUS Graph-to-Table CFX-9850GC PLUS Graph-to-Table CFX-9950GB PLUS Graph-to-Table fx-9750G PLUS Graph-to-Table CFX-9850G PLUS Sketch Function CFX-9850GB PLUS Sketch Function CFX-9850GC PLUS Sketch Function CFX-9950GB PLUS Sketch Function fx-9750G PLUS Sketch Function CFX-9850G PLUS Dynamic Graph CFX-9850GB PLUS Dynamic Graph CFX-9850GC PLUS Dynamic Graph CFX-9950GB PLUS Dynamic Graph fx-9750G PLUS Dynamic Graph CFX-9850G PLUS Table & Graph CFX-9850GB PLUS Table & Graph CFX-9850GC PLUS Table & Graph CFX-9950GB PLUS Table & Graph fx-9750G PLUS Table & Graph CFX-9850G PLUS Implicit Function Graphs CFX-9850GB PLUS Implicit Function Graphs CFX-9850GC PLUS Implicit Function Graphs CFX-9950GB PLUS Implicit Function Graphs fx-9750G PLUS Implicit Function Graphs CFX-9850G PLUS Recursion Table and Graph CFX-9850GB PLUS Recursion Table and Graph CFX-9850GC PLUS Recursion Table and Graph CFX-9950GB PLUS Recursion Table and Graph fx-9750G PLUS Recursion Table and Graph CFX-9850G PLUS List Function CFX-9850GB PLUS List Function CFX-9850GC PLUS List Function CFX-9950GB PLUS List Function fx-9750G PLUS List Function CFX-9850G PLUS Financial Calculations CFX-9850GB PLUS Financial Calculations CFX-9850GC PLUS Financial Calculations CFX-9950GB PLUS Financial Calculations fx-9750G PLUS Financial Calculations CFX-9850G PLUS Data Communications CFX-9850GB PLUS Data Communications CFX-9850GC PLUS Data Communications CFX-9950GB PLUS Data Communications fx-9750G PLUS Data Communications CFX-9850G PLUS Programming CFX-9850GB PLUS Programming CFX-9850GC PLUS Programming CFX-9950GB PLUS Programming fx-9750G PLUS Programming CFX-9850G PLUS Program Library CFX-9850GB PLUS Program Library CFX-9850GC PLUS Program Library CFX-9950GB PLUS Program Library fx-9750G PLUS Program Library CFX-9850G PLUS Statistical Graphs and Calculations CFX-9850GB PLUS Statistical Graphs and Calculations CFX-9850GC PLUS Statistical Graphs and Calculations CFX-9950GB PLUS Statistical Graphs and Calculations fx-9750G PLUS Statistical Graphs and Calculations fx-9750G Graph Solve fx-9750G Dual Graph fx-9750G Graph-to-Table fx-9750G Data Communications fx-7400G PLUS Data Communications fx-9750G Program Library fx-7400G Program Library fx-7400G PLUS Program Library fx-9750G Financial Calculations fx-7400G Programming fx-7400G PLUS Programming