C&D Technologies RS-1476 Standby Battery Vented Cell User Manual
Page 24
Lower than normal temperatures have the opposite effects. In general, at
recommended float voltage, a battery in a cool location will last longer and require
less maintenance than one in a warm location. If the operating temperature
is something other than 77°F (25°C), it is desirable to modify the float voltage
(temperature compensate) as follows:
For electrolyte temperatures other than 77°F (25°C), correct individual cell float
voltage by 2.8 mV/°F (5.0 mV/°C):
• Add 2.8 mV (0.0028 Volt) per °F (5.0 mV/°C) below 77°F (25°C)
• Subtract 2.8 mV (0.0028 Volts) per °F (5.0 mV/°C) above 77°F (25°C)
Example:
LCT 1680
Nominal float @ 77°F is 2.20 Vpc
Corrected float @ 67°F is 2.228 Vpc
Corrected float @ 87°F is 2.172 Vpc
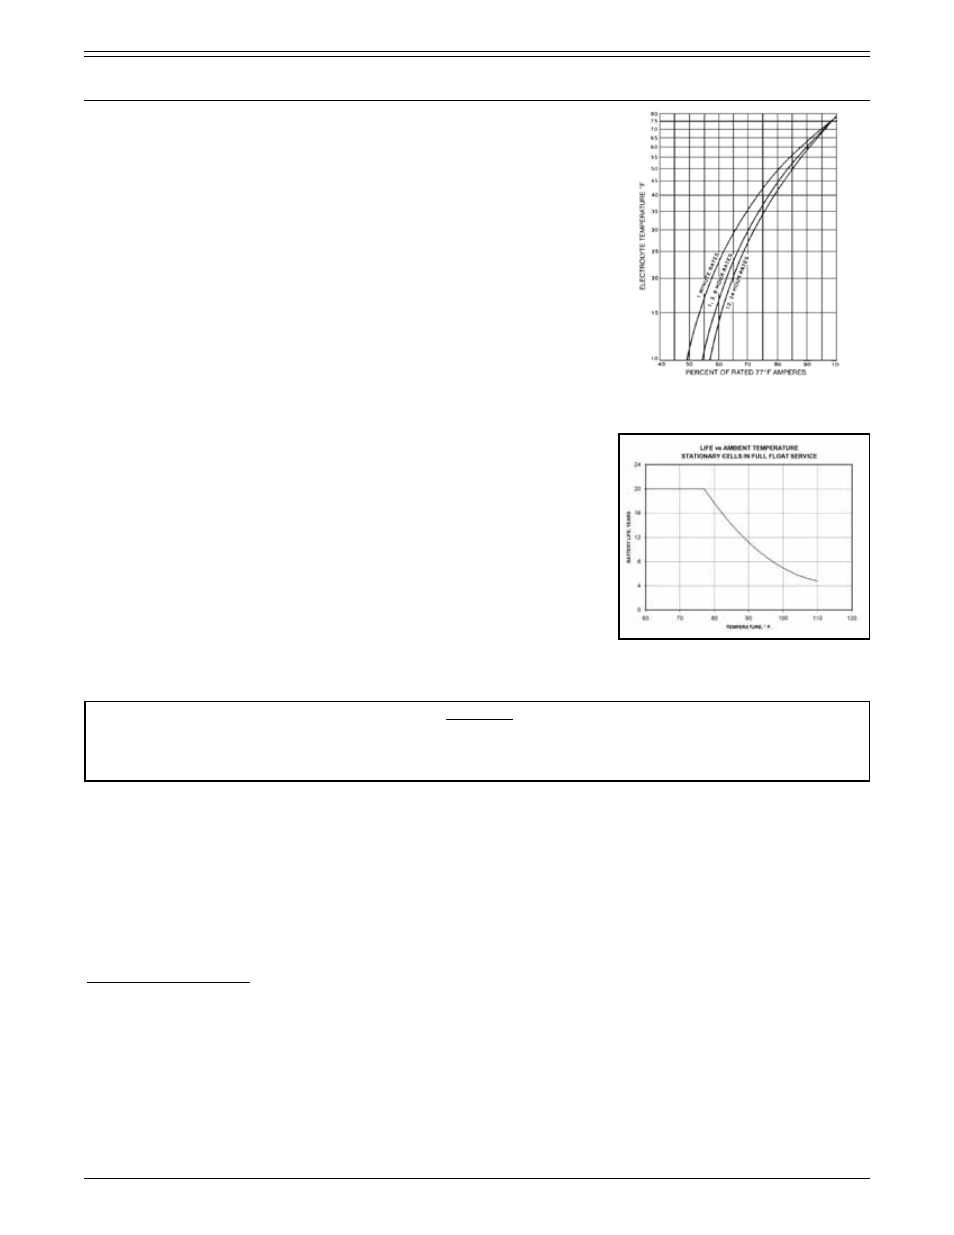
At higher than normal operating temperatures, for every additional 15°F (8°C)
battery life is decreased by 50 percent. Therefore, continued operation at an
average cell temperature of 92°F (33°C) will reduce battery life to 50 percent of
that typical at 77°F (25°C). See Figure 4.1.4
At lower than normal operating temperatures, battery performance will be reduced
as shown in Figure 4.1.3.
Electrolyte level
When water is lost from the electrolyte the result will be a more
concentrated solution and thereby a higher specific gravity reading.
The reverse condition applies when water has been added to adjust
electrolyte level. The apparent level can be significantly effected by
charging voltage. If the voltage is higher than specified in the float
tables or if the battery is being charged at equalize voltage, gases
will be generated displacing the electrolyte causing the level to rise.
CAUTION
Never allow electrolyte level to drop below the bottom of the flame arrestor vent tube. Should this
occur, hydrogen generated within the cell will not be contained by the flame arrestor and ignition due
to external source is possible from an outside spark or flame.
Recharge and Electrolyte Stratification
When the battery is discharged, the specific gravity of its electrolyte is reduced. This is a result of the utilization of sulfate
ions in the chemical reaction with the active materials in the positive and negative plates. The sponge lead in the negative
plate and the lead dioxide in the positive plate convert to lead sulfate, combining the sulfate ions of the electrolyte with
the lead compounds in the plates.
On recharge, lead sulfate in the plates is converted back to the original compounds and the sulfate ions are released
from the plates. The sulfate ions combine to produce sulfuric acid with a density greater than that of the electrolyte.
As a result, the newly generated, concentrated (heavy acid) falls to the bottom of the cell container. Specific gravity
measurements taken at the top of the cell will be lower than those taken at the bottom. This physical condition is called
electrolyte stratification.
Stratification does not materially inhibit the ability of a lead acid battery to deliver power. However, battery performance
will be less than optimum and specific gravity measurements must take into consideration the non-homogeneity of the
electrolyte. Specific gravity measurements may not reflect the average cell gravity.
There are two ways to eliminate stratification. The first is to provide sufficient time for chemical diffusion. This can take
several weeks or longer at float potential, depending upon the degree of stratification.
A more efficient method is to provide an equalize charge voltage that will mix the electrolyte. Gases produced by an
equalizing charge stir up the electrolyte, causing uniformity throughout the cell. After a relatively short time, the electrolyte
will become mixed and homogenous. The degree of gassing and, hence the setting for the equalize potential are directly
associated with the time required for mixing.
FIGURE 4.1.3 - Battery capacity versus operating
temperature. See Appendix D for full chart
PART 4
REFERENCE INFORMATION, TROUBLE SHOOTING & EXTENDED MAINTENANCE (CONTINUED)
RS1476/0215/CD
22
www.cdtechno.com
FIGURE 4.1.4
Battery Life versus ambient temperature
See Appendix D for full chart