Vessel attachments, Piping, Example i – Rice Lake Weigh Modules/Mount Assemblies User Manual
Page 55
3-3
VESSEL ATTACHMENTS
Piping
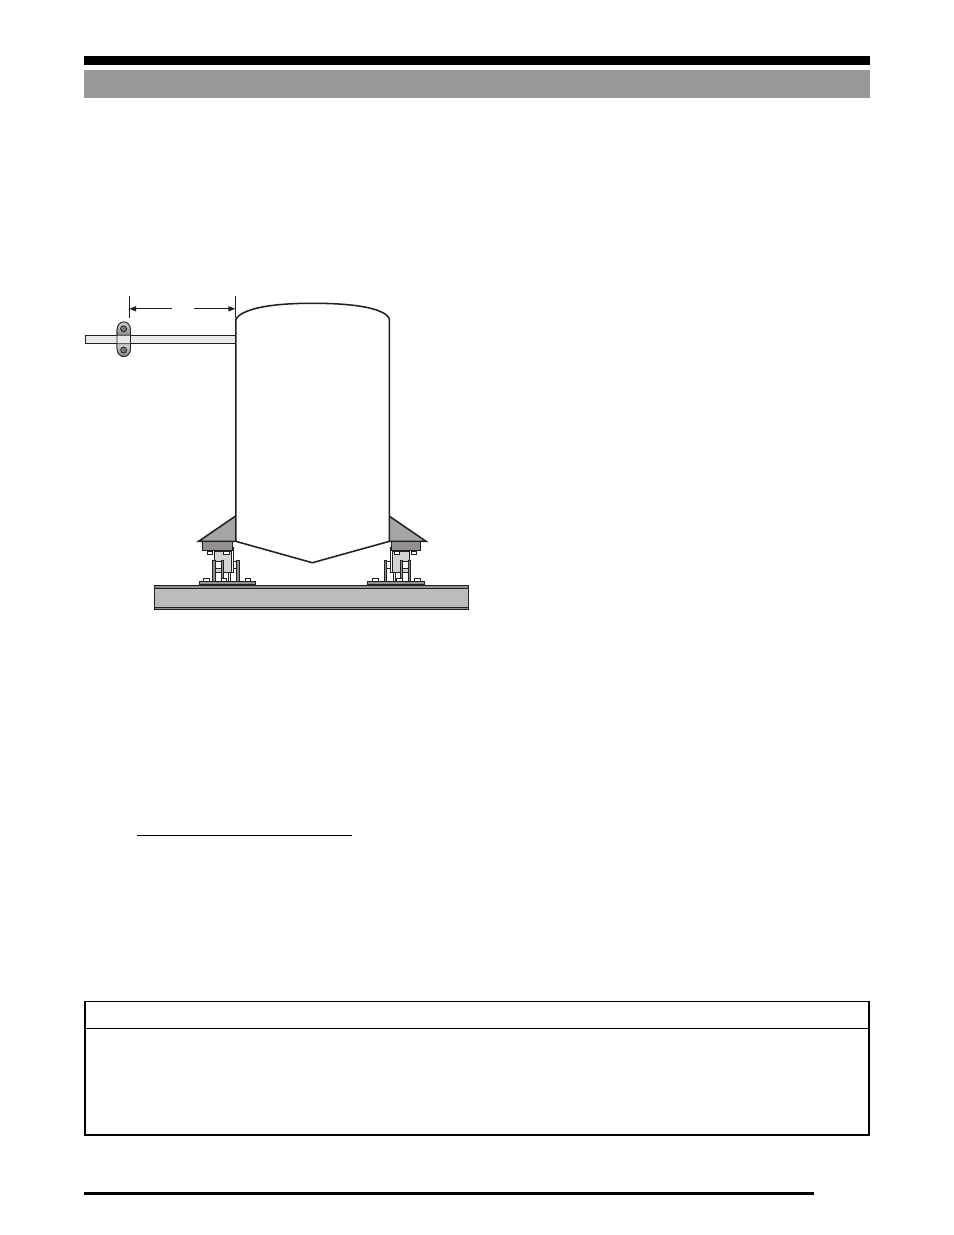
Figure 3-3
Example 2 shows the effect of doubling the length of pipe between
the vessel and first support point. The 87% reduction shows that F
1
can be greatly decreased by increasing the distance to the first
support point.
Example 3 shows the effect of cutting the structural deflection in
half from .250" to .125" (the load cell deflection of .008" remains the
same). It is obvious from the 48% reduction in Table 1 that F
1
can
be moderately decreased by reducing the vessel’s deflection.
Example 4 shows the effect of using a lighter-wall schedule 10S
pipe instead of schedule 40.
Example 5 shows the effect of reducing the size of the pipe from 4"
schedule 40, to 2" schedule 40. From the large 93% reduction, it is
clear why you should always use the smallest diameter pipe suitable
for the application.
These and other Do’s and Don’ts are summarized in the Piping
Guidelines section. Note that while the emphasis here is on at-
tached piping, these recommendations apply equally to attached
electrical conduit and cables.
If several pipes are attached to a vessel, the vertical force exerted on
the vessel can be calculated for each individually, as described
above, then added together to get the total force F acting vertically
on the vessel. That is:
F = F
1
+ F
2
+ F
3
…
where F
1
is the force exerted by pipe 1, F
2
the force exerted by pipe
2, etc.
Accepted practice in the scale industry for ensuring that piping does
not adversely affect the required accuracy is to ensure that the
following relationship is satisfied:
F
≤
.1 x system accuracy (in%) x live load (lb)
* For 4" Schedule 10S, D=4.50, d=4.26
†
For 2" Schedule 40, D=2.38, d=2.16
From the above information:
∆
h = .008" + .250" = .258"
E(steel) = 29,000,000
For schedule 40 pipe, D = 4.50, d = 4.03
l = 36"
hence:
F
1
=
=
13,840 lb.
The first line of Table 1 (Example 1) summarizes the above result. The
other lines (Examples 2–5) represent the result when one parameter is
changed. The last column on the right expresses the % change in F
1
relative to Example 1 (13,840 lb).
Table 1
Example
Pipe
Pipe Length(l) Deflection(
∆
h
) Upward Force(
F
1
) Percentage Reduction in (
F
1
)
1
4" schedule 40
36"
.258
13,840
---
2
4" schedule 40
72"
.258
1,730
87%
3
4" schedule 40
36"
.133
7,130
48%
4
4" schedule 10S*
36"
.258
7,630
45%
5
2" schedule 40
†
36"
.258
976
93%
Example I
A steel tank is supported on load cells and a steel structure with
deflections of .008" and .250" respectively under load. A 4" schedule
40 pipe is attached horizontally with 36" free span between the
vessel and the first support point. What force F
1
is exerted upward
on the vessel?
36"
.59(4.50
4
– 4.03
4
) x .258 x 29,000,000
36
3