Bar charts – HP 49g Graphing Calculator User Manual
Page 99
Attention! The text in this document has been recognized automatically. To view the original document, you can use the "Original mode".
Bar charts
A bar chart provides a visual representation of the relative magnitudes of
the values in a specified colimin of a data matrix.
HiriDOH -
PLOT SETUP
Tuni
EDl=lT:rg.|
Bo.' Hidth: .?5
hi
C-M.: 1
H-Tick:10. y-Tick:lD. ¿PiXi'.?
Efitif HiniMUH hcriSCTitOt MaUj«
EriOi-SC typ4 of pl.O-t
Figure 4-31: DefauU plot window and plot setup parameters for bar charts
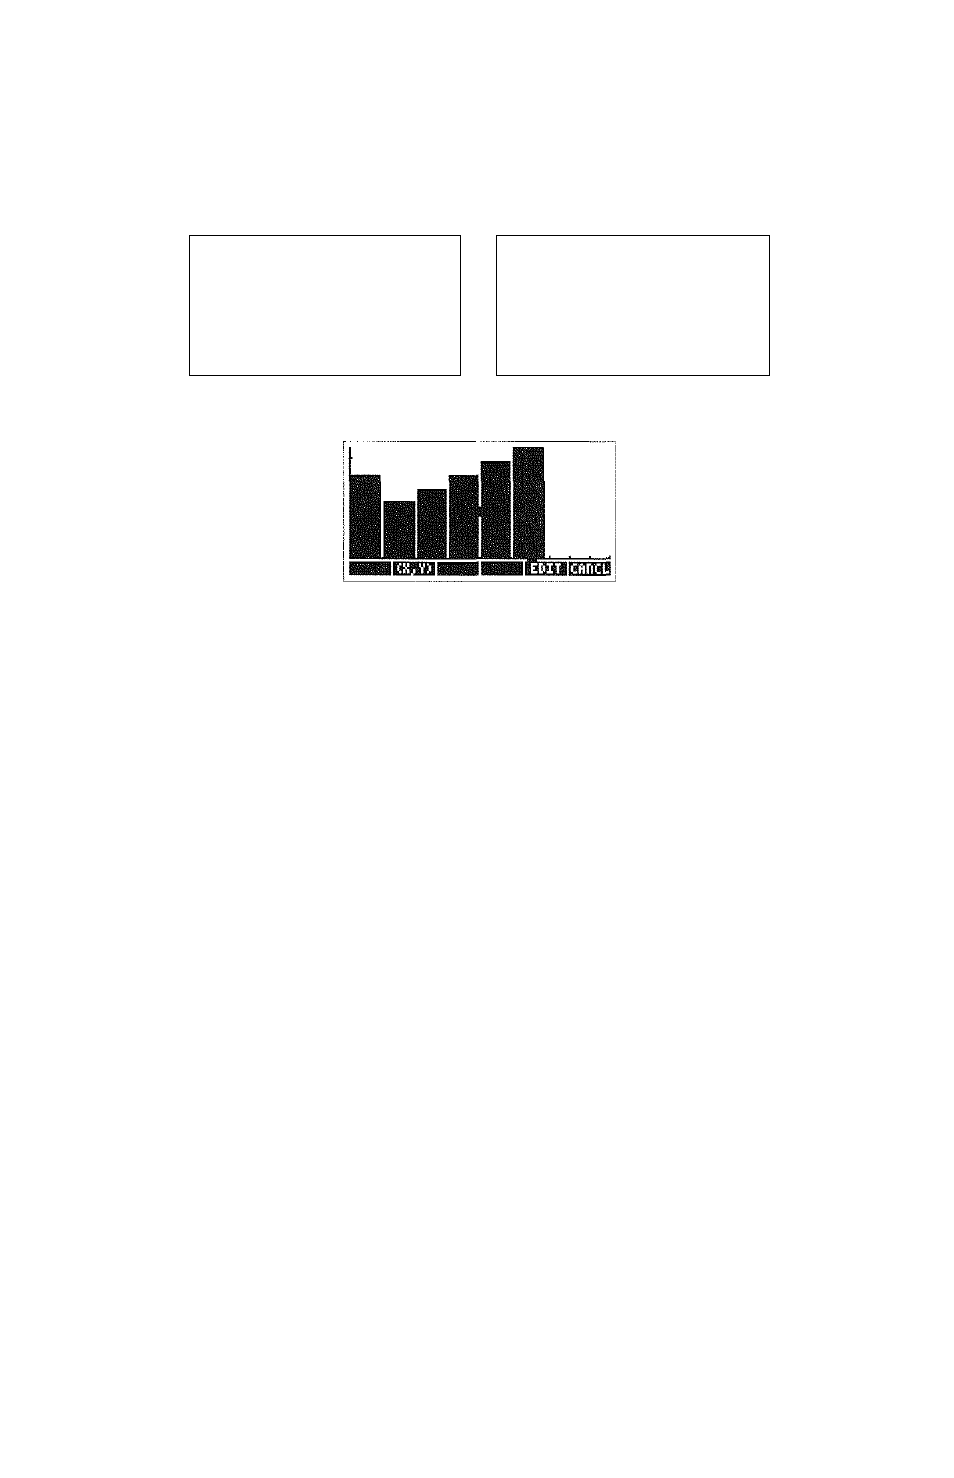
Figure 4-32: Sample bar chart
Plot window parameters
H-View
The horizontal display range, with the minimum
horizontal value in the first field and maximum horizontal
value in the second field.
V-View
The vertical display range, with the minimum vertical
value in the first field and maximum vertical value in the
second field.
Bar Width
The width of each bar. The default setting is one imit.
Auto
Resets the horizontal display range to fit the total number
of elements in the Col field, and resets the vertical display
range to span from the minimum value to the maximum
value of the elements in the Col field.
Plotting graphs
Page 4-31