Basic plotting, To draw a non-statistical plot, Basic plotting -3 – HP 49g Graphing Calculator User Manual
Page 71: Choos, Clear
Attention! The text in this document has been recognized automatically. To view the original document, you can use the "Original mode".
Basic plotting
The HP 49G’s plotting application enables you to graph functions. You can
create the functions before opening the application, or create a function
once the plotting application is open.
You can also plot statistical data. Statistical data needs to be placed in a
matrix before it can be plotted. You can create the matrix before opening
the plotting application, or create it once the application is open.
You can plot any number of fimctions at one time; however, you can only
draw one statistical plot at a time. You can, however, superimpose a new
statistical plot over a previously drawn statistical plot.
To draw a non-statistical plot
1
.
to display the Plot Setup
^ PLOT SETUPS
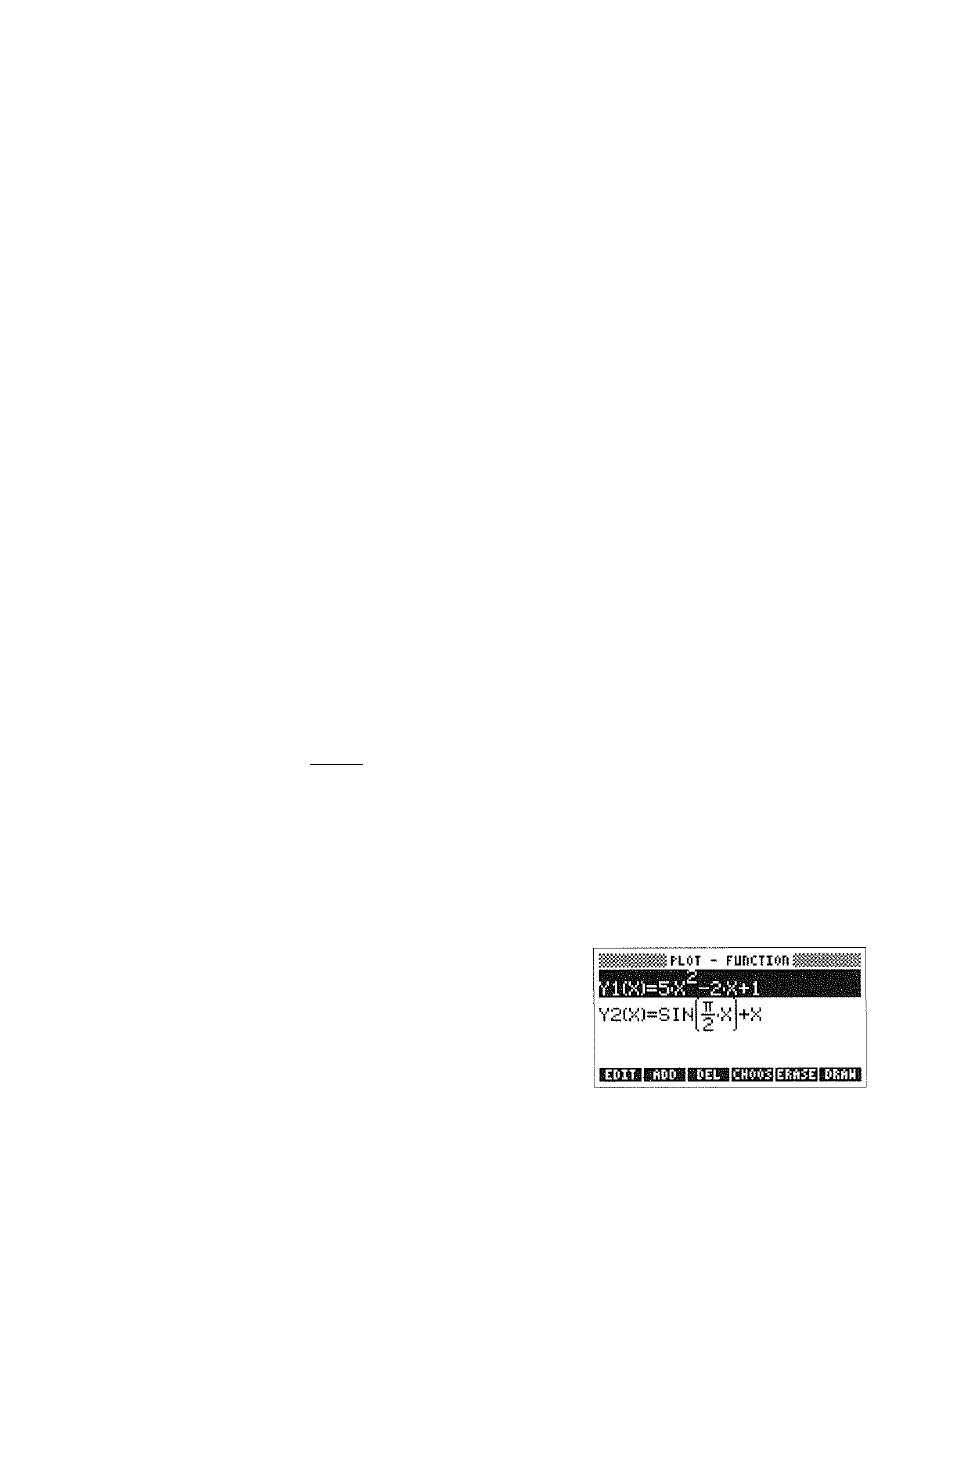
T y D «: 1 Irid«p:H SiMUtt ¿Conflict H-TiCh:iO. y-TiCh:lll. ¿PiXi l5 type plot Press 2. If the type of plot you want to draw is not the one shown in the Type field, press CHOOS and select a new plot type. You can also select a plot type by pressing (ALPHA) and the first letter of the name of the plot type. For example, to select gridmap, press (IPHA) G. The value in the Type field changes to the plot type you selected. 3. Change whatever plotting parameters need changing. The parameters on the Plot Setup screen vary according to the type of 4. Press 0{Yi). The Plot - Function screen is displayed. plotted. 5. To delete all the functions listed, press CLEAR. 6. To delete a particular fmrction but keep others, use the arrow keys to highlight the function and press DEL. If you find you have deleted a function by accident, press @SD 0Si). Plotting graphs Page 4-3
EtiiViiH) va
screen.
plot you are drawing. They are discussed later. (See “Plot types” on
page 4-6.).
This screen lists the functions you last