Scatter plots – HP 49g Graphing Calculator User Manual
Page 97
Attention! The text in this document has been recognized automatically. To view the original document, you can use the "Original mode".
A scatter plot shows the relationship between two variables by plotting an
x-y coordinate point for each item in a sample. For variables that are
statistically correlated, the points should cluster along some cmve.
Scatter plots
HIF
j
DOH - SCftTTER^^^
PLOT SETUP ■ ■ .■
il.
TMPC :WCTIfniglg
y-Mi«H:-.075 12.
EDflT:fS. S. 1
h- 3.
Ccl5:i 2
H-Tich:10. V-Tich:10. ¡¿PiXilS
Efttir HiniHUH h«>ri2<>rit'al MOlUi
typi Of put
Figure 4-29: Default plot window and plot setup parameters for scatter plots
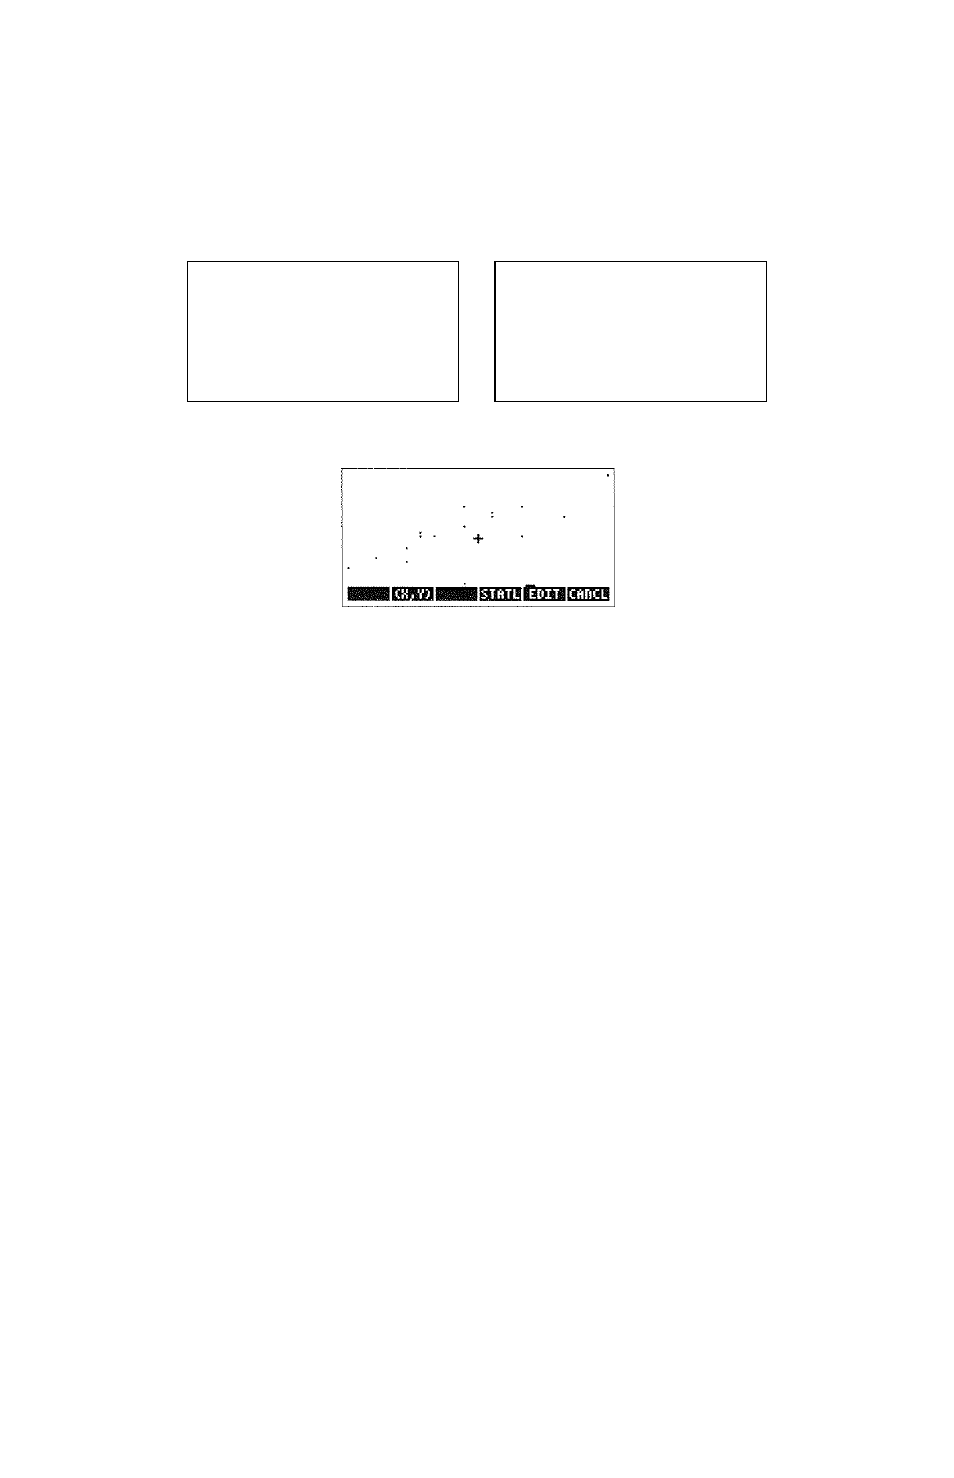
Figure 4-30: Sample scatter plot
Plot window parameters
H-View
The horizontal display range, with the minimum
horizontal value in the first field and maximum horizontal
value in the second field.
V-View
The vertical display range, with the minimum vertical
value in the first field and maximum vertical value in the
second field.
Auto
Resets the horizontal display range to span the minimum
value and the maximum value of the variable in the first
Cols field, and resets the vertical display range to span
the minimum value and maximum value of the variable in
the second Cols field. (The Cols field is explained in the
next section.)
Plotting graphs
Page 4-29