Parametric plots, Parametric plots -8, X{t) – HP 49g Graphing Calculator User Manual
Page 76
Attention! The text in this document has been recognized automatically. To view the original document, you can use the "Original mode".
H-Tick
V-Tick
Pixels
The nmuber of imits (or pixels) between tick marks on
the horizontal axis. The default is one tick every 10 pixels.
Wliether rmits or pixels is used depends on the setting in
the Pixels field (see below). This field is only available if
you have chosen to display axes. Press (£4) to include or
exclude axes.
The number of pixels or units between tick marks on the
vertical axis. The default is one tick every 10 pixels.
Wliether imits or pixels is used depends on the setting in
the Pixels field (see below).
This field is only available if you have chosen to display
axes. Press (F4) to include or exclude axes.
When checked—which is the default—the values in the
H-Tick and V-Tick fields are interpreted as pixels. When
imchecked, these values are interpreted as units.
This field is only available if you have chosen to display
axes. Press (T?) to include or exclude axes.
Parametric plots
A parametric plot is a compoimd of two equations, with the dependent
variable in each bemg a function of the same independent variable. An
example is
x{t) =
3sin(3i) and y(i) = 2sin(4i). You need to combine both
equations into the form
a
-t-
bi
where
a
is the first equation and
b
is the
second equation. To continue the example, you would need to specify, as
the equation to plot, 3sin(3i) + 2sin(40i.
^^PLO T HiriD O H - PiiRiiH ETRIC^^
PLO T JETUP
H
—V a. 5 H •
TMDSUSirajrtSilWt d;Flad
3.2
Ihdip L
oh
: DiFOUtt Hi^h:D«Foutt
Irid«p:t SiMUtt ¿CC-nriiCt
H-Tich:i0. V-TicR:iLl. ¡¿PiXCtS
Ent«r HirtiHUH h<>ri2':«rit>3t uoty«
Choose type oF plot
Figure 4-5: Default plot window and plot setup parameters for parametric plots
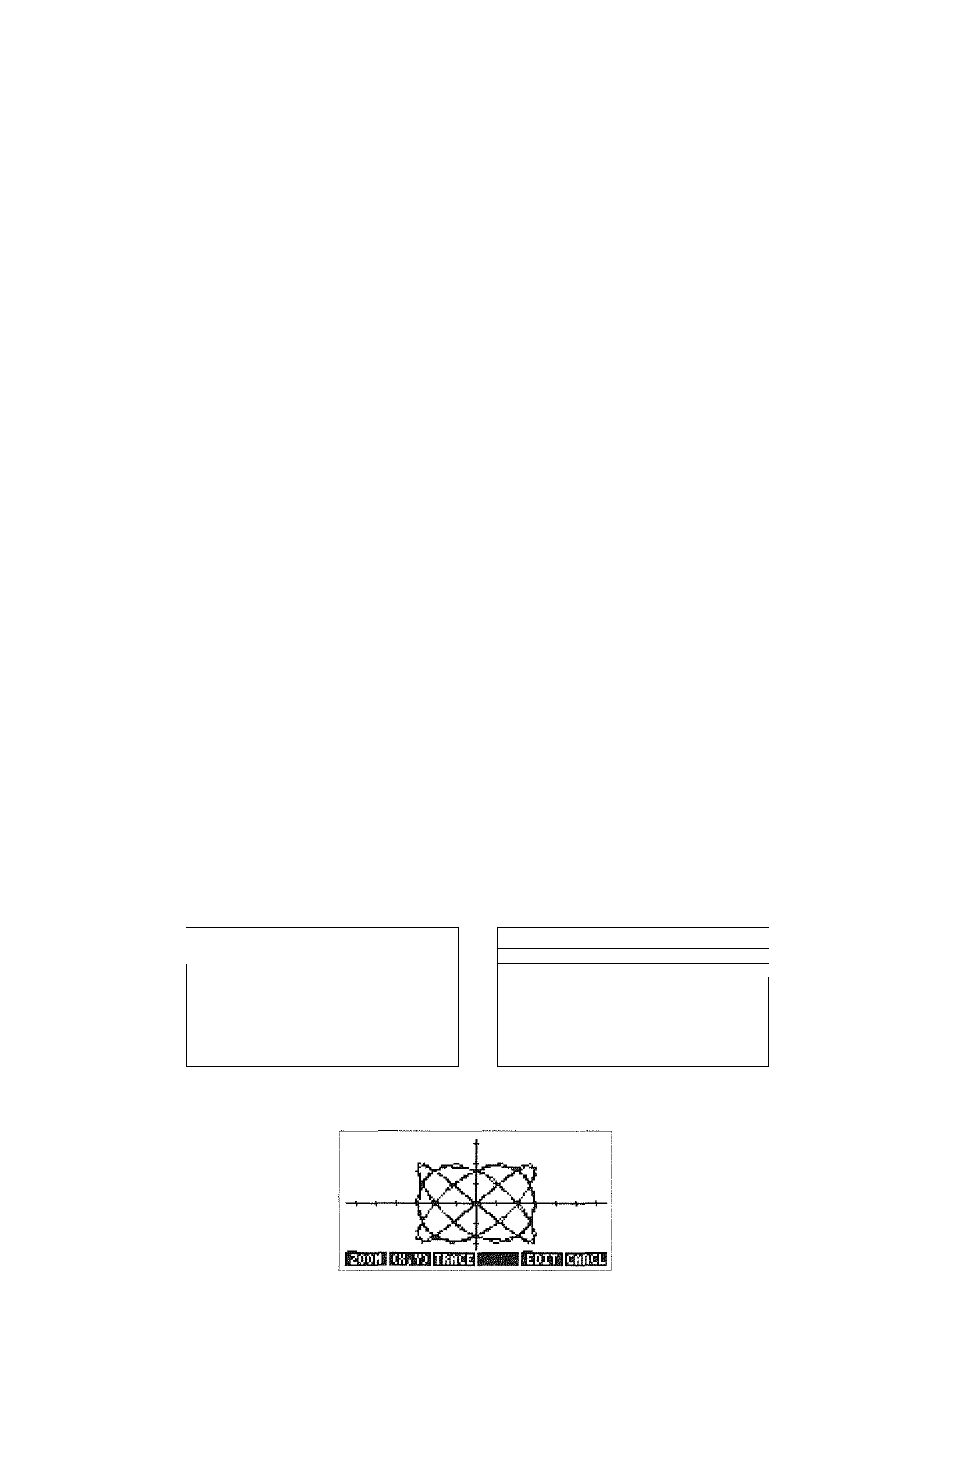
Figure 4-6: Sample parametric plot
Page 4-8
Plotting graphs