Type, Histograms – HP 49g Graphing Calculator User Manual
Page 101
Attention! The text in this document has been recognized automatically. To view the original document, you can use the "Original mode".
Histograms
A histogram is a repi'esentation of a frequency distribution. The length of
each bar in a histogram indicates how many items fall within its range.
^^PLOT HiriDOH -
SETUP
e.5
TMng:i!wamgmi
le.
EDflT:r i.2 1
Bar Hidth:.?5
h i l
Cc-u i
H-TiCh:lD. s£PiX«l.5
Eri'iir HiniHUH hori2-?fttai. yaUj«
chooii tap«
( f f
put
Figure 4-33: Default plot window and plot setup parameters for histograms
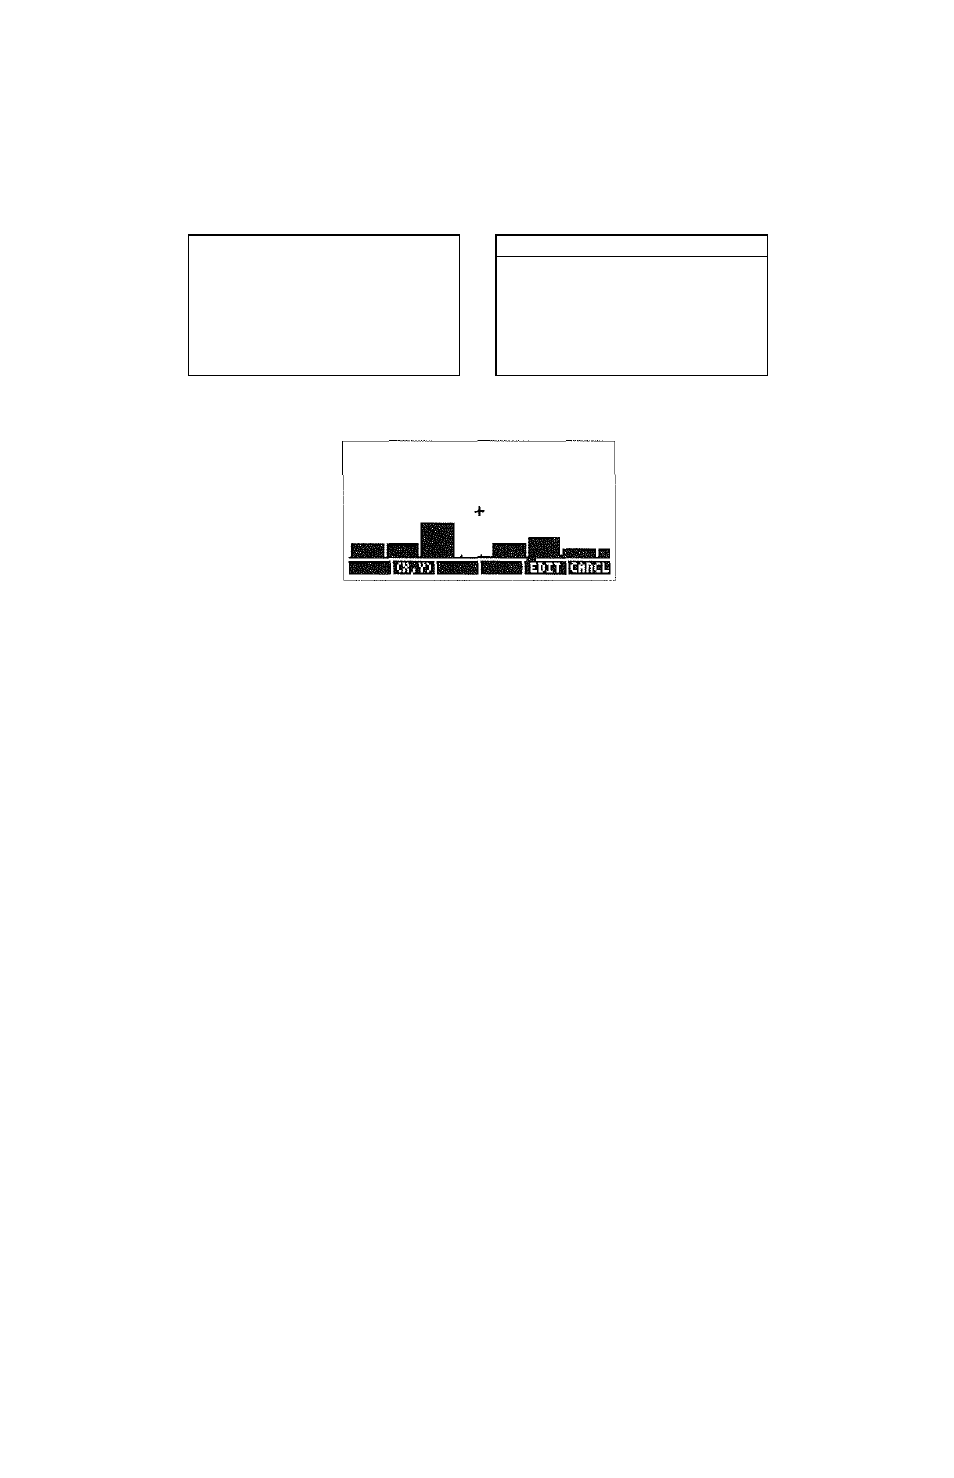
Figure 4-34: Sample histogram
Plot window parameters
H-View
The horizontal display range, with the minimum
horizontal value in the first field and maximum horizontal
value in the second field.
V-View
The vertical display range, with the minimum vertical
value in the first field and maximum vertical value in the
second field.
Bar Width The width of each bar. The default setting is one unit
Auto
Resets the horizontal display range to span from the
iTiinimum value to the maximum value of the elements in
the Col field, and resets the vertical display range to span
from zero to the total number of rows in ZD AT.
Plot setup parameters
Type
ZDAT
The type of plot.
The data matrix, or name of the data matrix, containing
the data to be plotted.
The name of a matrix is the name you gave it when you
stored it as a variable. (See chapter 7, “Storing objects”,
for information on storing objects in variables.) If you are
entering the data matrix directly, the entire matrix, and
Plotting graphs
Page 4-33