4 experion video tutorials – Bio-Rad Experion DNA Analysis Kits User Manual
Page 10
6
Technical Support: 1-800-4BIORAD • 1-800-424-6723 • www.bio-rad.com
n
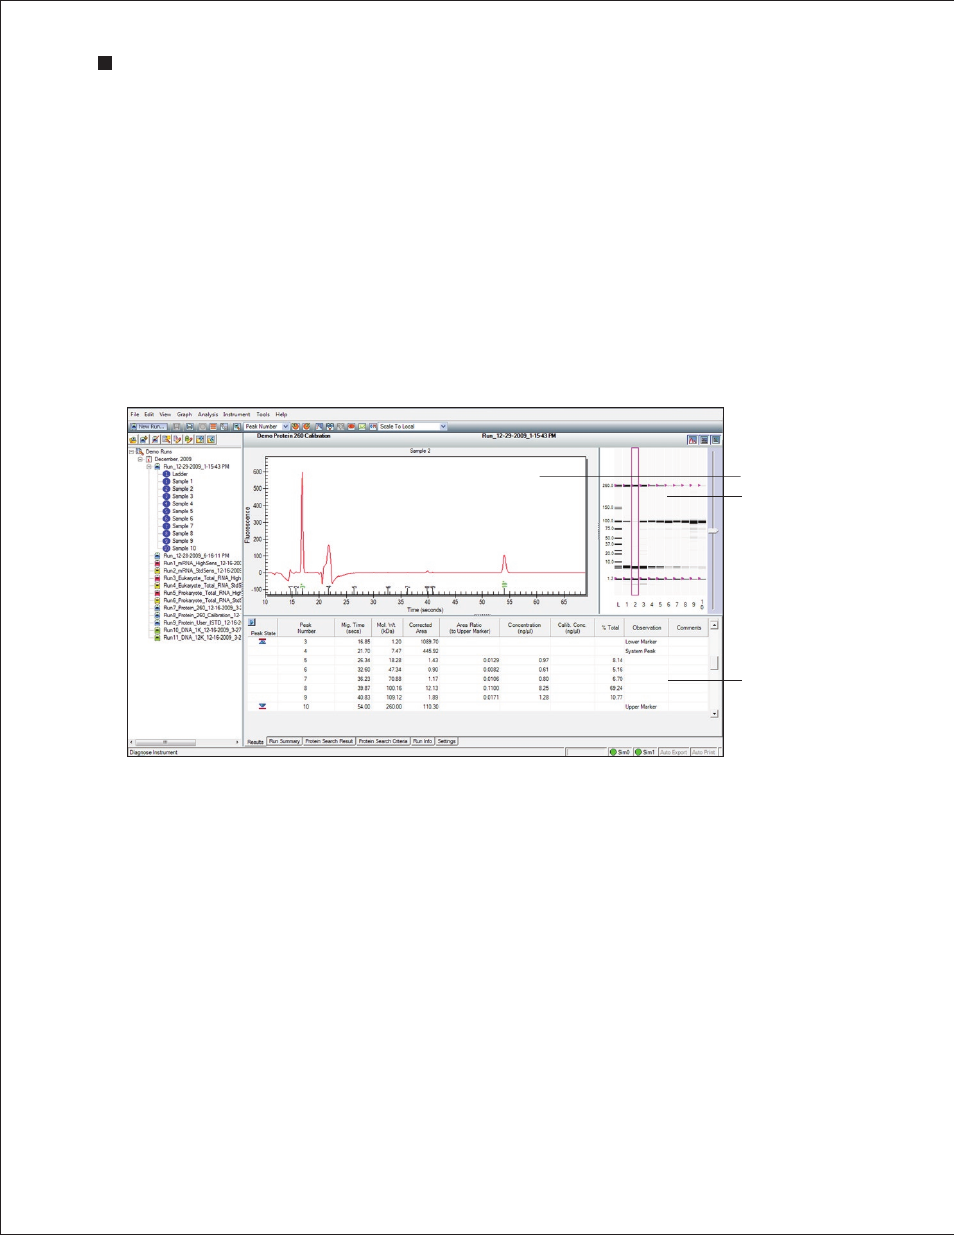
Detecting the molecules — As the molecules migrate toward the end of the separation
channel, a laser excites the dye, causing it to fluoresce if it is bound to the protein-LDS
micelle complexes or RNA/DNA fragments. A photodiode detects the fluorescence, and
Experion software plots the fluorescence intensity as a function of time to produce an
electropherogram. A virtual gel image is generated from the electropherogram data
n
Data analysis — Once separation is complete, the software subtracts background noise,
identifies and integrates peaks, and assigns their sizes and concentrations; the results
of data analysis are automatically tabulated and presented in a table. Experion software
displays all three forms of data simultaneously (Figure 1.6)
For detailed information on how the Experion automated electrophoresis system performs separation
and analysis, refer to the instruction manuals for each analysis kit (available online at www.bio-rad.com,
search term “Experion”).
1.4 Experion Video Tutorials
For additional information, view the video tutorials available online at www.bio-rad.com:
North America: ng >
Experion System Training
Other:
Home > Life Science Research > Electrophoresis > Automated Electrophoresis >
Experion Training Videos
Experion Automated Electrophoresis System
Fig . 1 .6 . Experion software display . The results of an Experion Pro260 analysis are shown.
Electropherogram
Virtual gel
Results table