Modifying the parameters for the graph, Viewing area, Legend – ADS Environmental Services PrimeWorks QR 775018 A0 User Manual
Page 68
ADS PrimeWorks User Manual
62
Modifying the Parameters for the Graph
This section addresses the following topics concerning the modification of
graph parameters:
Viewing area
Legend
Date/time range
Current trace
Query point (x and y values)
Viewing Area
Moving the cursor over the scale and title areas of the graph causes the cursor
to change into a dot and arrow. Clicking when the left, right, up, or down arrow
and dot are shown moves the graph area in the direction of the cursor. The
scales re-calculate and display based on the movements.
Clicking the maximize button on the graph window expands the graph to the
maximum size and removes the window’s borders.
Legend
The Legend indicates the colors representing each trace on the graph and the
parameters for the trace data. When the graph includes more than 3 traces, the
Legend window provides a scroll bar for scrolling through the colors and
details of all the traces. The user also can use the mouse wheel to scroll
through the Legend window.
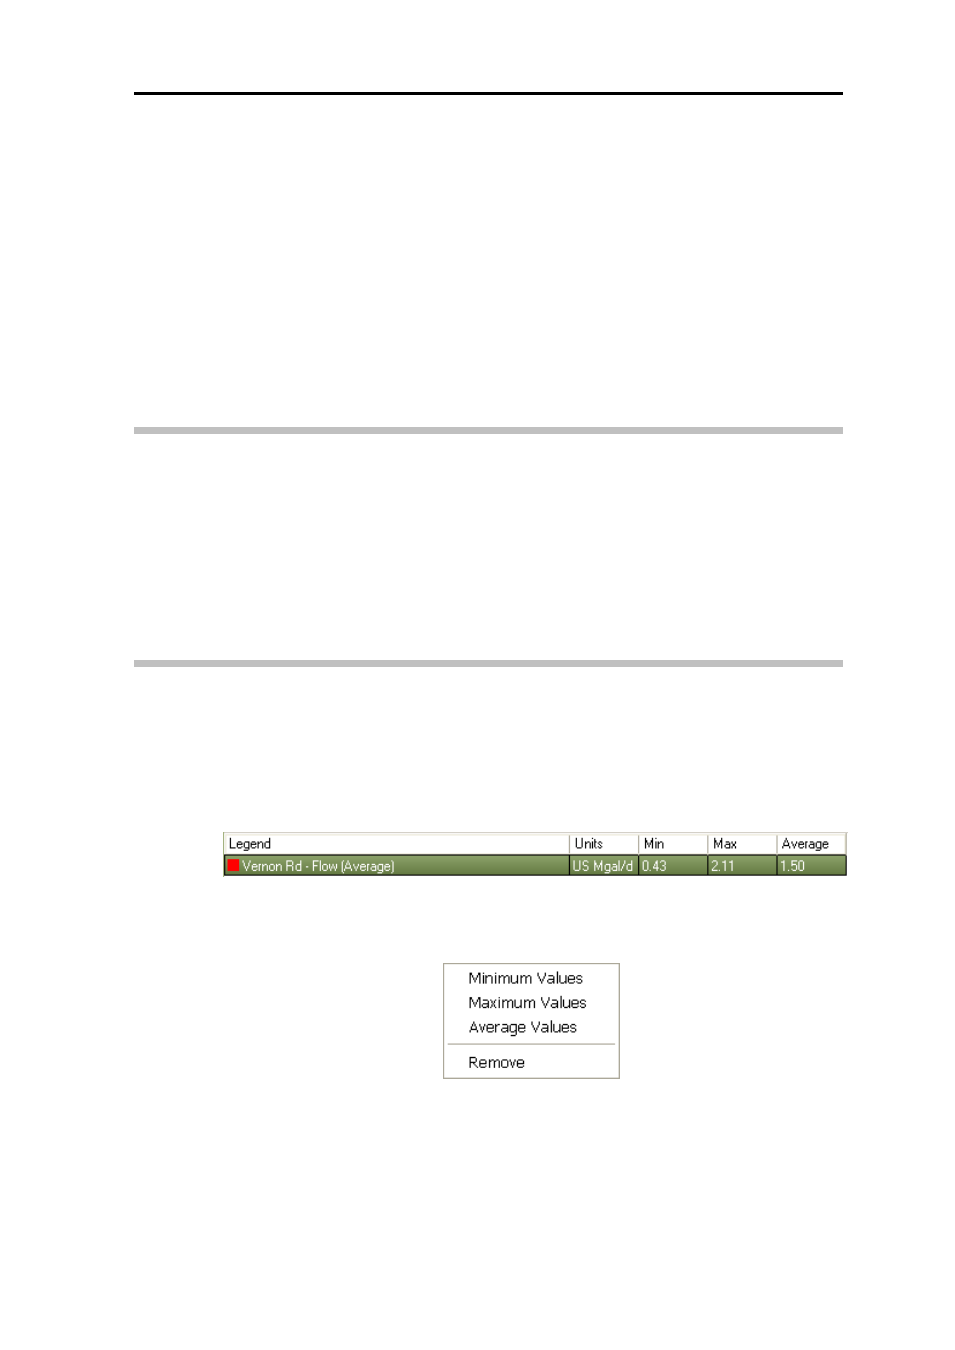
Legend below graph display
Increase the boldness of a trace by clicking on the appropriate trace on the
Legend. Right-clicking the trace name displays the following menu:
Menu displayed when right-clicking a trace entry on the Legend
Selecting one of the value options from the menu displays a line on the graph
corresponding to that value for the selected trace. Remove a trace from the
graph by selecting the Remove option.