History graph – Rockwell Automation RSLogix 5000 Fuzzy Designer User Manual
Page 117
Publication LOGIX-UM004A-EN-P - March 2007
FuzzyDesigner Projects 117
History Graph
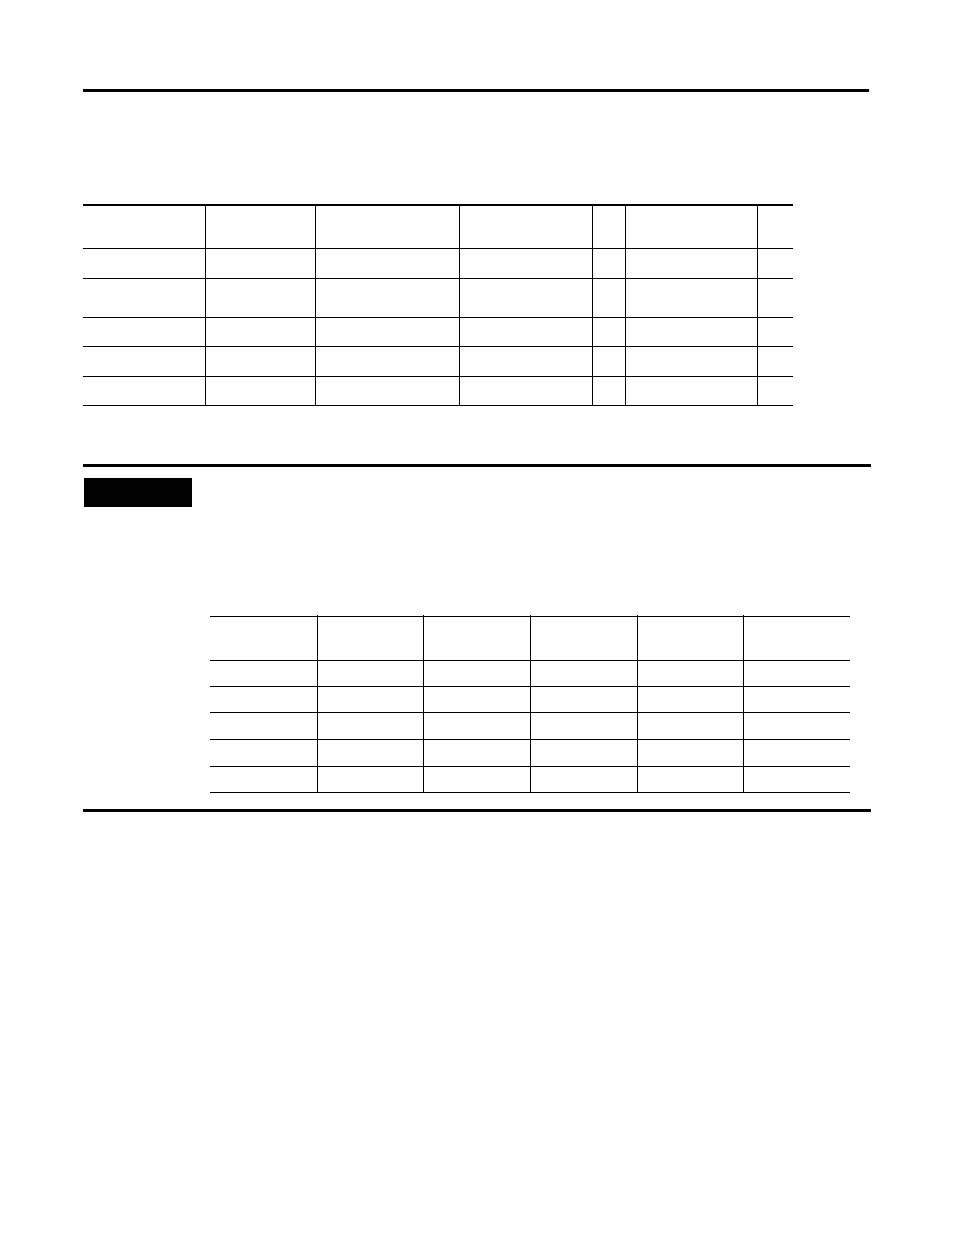
The History Graph is a Watch Tool component that displays measured
or simulated data.
The creating and setting of initial parameters are explained in the
section Watch.
The created graph can be either absolute or relative. You can select
the graph type by clicking the first button on the history graph tool
bar, and you can see this from a status bar at the top right corner of
the graph window.
Sample Time
[ms]
Time
Input Name 1
Input Name 2
…
Output Name 1
…
t
elapsed
- (N
H
-1)T
s
t
actual
- (N
H
-1)T
s
u
1
(t
elapsed
- (N
H
-1)T
s
)
u
2
(t
elapsed
- (N
H
-1)T
s
)
y
1
(t
elapsed
- (N
H
-1)T
s
)
t
elapsed
– 2 T
s
t
actual
– 2 T
s
t
elapsed
- T
s
t
actual
- T
s
u
1
(t
elapsed
- T
s
)
u
2
(t
elapsed
- T
s
)
y
1
(t
elapsed
- T
s
)
t
elapsed
t
actual
u
1
(t
elapsed
)
u
2
(t
elapsed
)
y
1
(t
elapsed
)
M
EXAMPLE
The monitored fuzzy system is the Ball. The data saved to the file are ball position error (pos_error),
velocity of the ball (velocity), and the beam angle (angle). Every output variable has two columns – the first
one stores values computed by FuzzyDesigner, the second one stores values loaded from the RSLogix 5000
project. Data was saved at 12:37:27.4, time elapsed from the monitoring start was 37 seconds. The defined
history depth was 100 samples. The both Sample Time CheckBox and Zero Based Sample Time in
milliseconds CheckBox were checked. Data was saved in the following form.
Sample Time
[ms]
Time
Pos_error
Velocity
Angle
Angle
(Controller)
17.2
12:37:07
-0.4569
0.756445
0.030031
0.030031
17.4
12:37:07
-0.30795
0.729367
0.158467
0.158467
36.8
12:37:27
-0.11491
0.475816
0.391279
0.391279
37.0
12:37:27
-0.05582
0.145594
0.107682
0.107682