RaySafe i2 Dose Manager User Manual
Page 41
41
RaySafe i2 dose manager user manual – Use dose manager
to change the graph colors, select a dosimeter and right-click on it. Select either dose graph color or dose rate
graph color and choose your preferred color and click ok.
nAVIGAte In A GRAPH
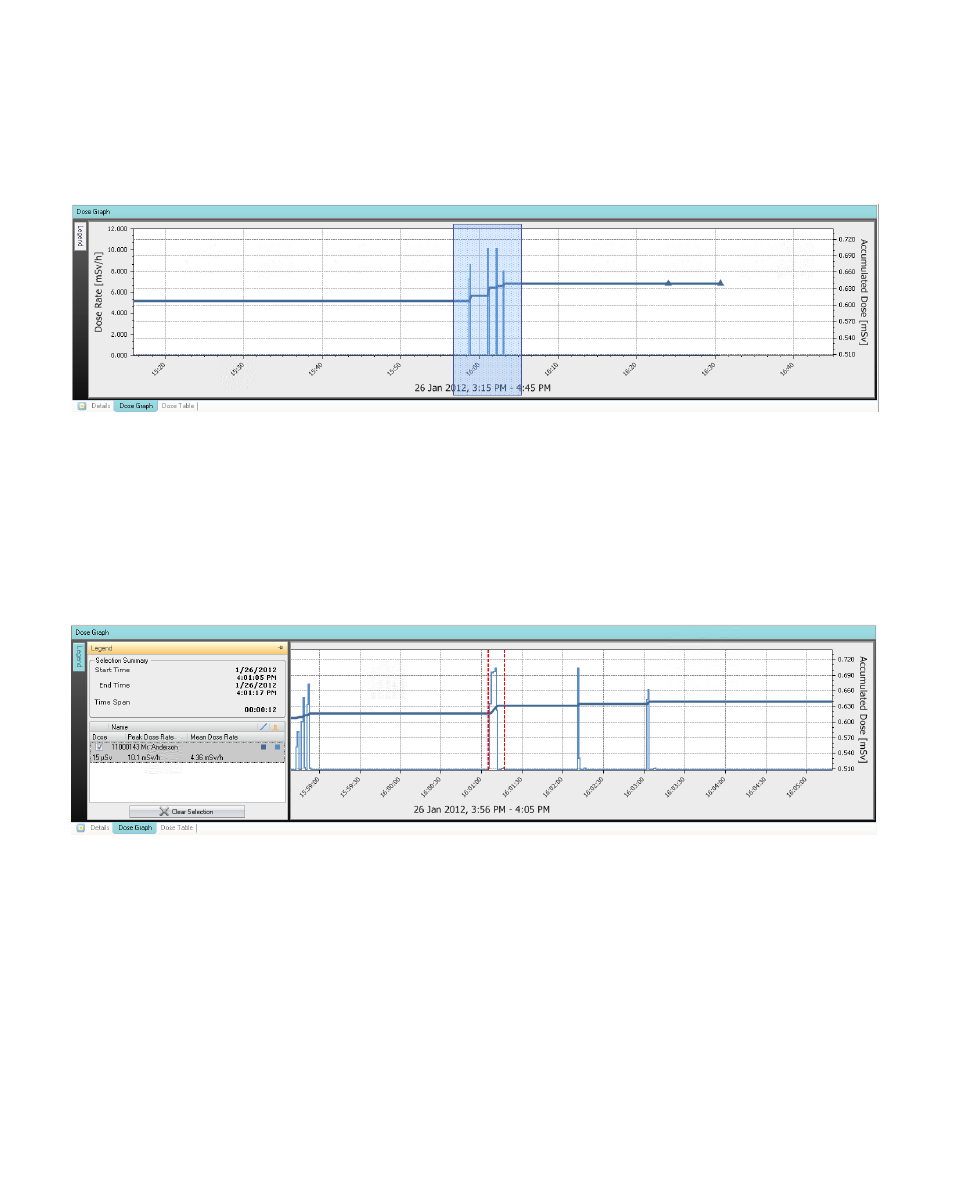
Figure 25. Zoom in a graph
Perform the following actions to navigate in a graph:
1. Use the mouse to left click and drag in the graph to increase the view magnification.
2. Use the tools in the dose navigation toolbar to navigate further in the graph.
mAke A SeleCtIon In A GRAPH
Figure 26. Make a selection in a graph
If you want to analyze a certain part of a graph further, follow the instructions below to make a selection, which
will give you more information:
1. Use the mouse to Shift-click and drag to select in the graph.
this makes a selection in a time span in the graph. the selection is indicated with vertical red dotted lines.
2. View detailed information from the selection in the graph legend.
3. Clear the selection by clicking Clear in the dose navigation toolbar.