Dose graph tab overview – RaySafe i2 Dose Manager User Manual
Page 29
29
RaySafe i2 dose manager user manual – Get to know dose manager
doSe GRAPH tAb oVeRVIew
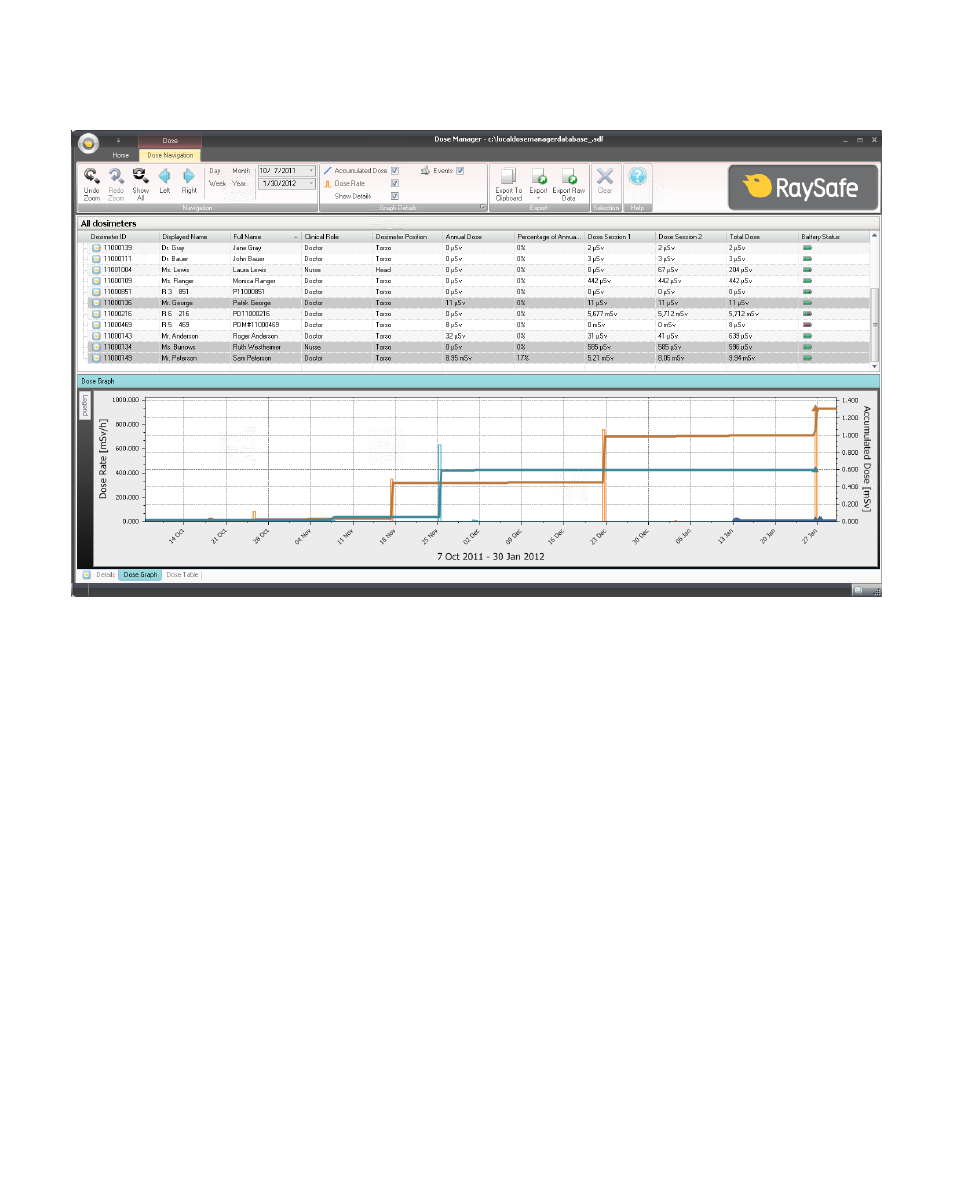
Figure 14. Dose graph overview
In the dose graph tab, data from one or several dosimeters will be presented as a graph. It is possible to
navigate in the graph and to customize the view according to your needs, see section “View dose history as a
graph” on page 40 and section “View dose history as a graph” on page 46 for instructions.
GRAPH leGend
In the graph legend you can see information about the graphs for different dosimeters.