Analyze dose history from one dosimeter – RaySafe i2 Dose Manager User Manual
Page 40
40
RaySafe i2 dose manager user manual – Use dose manager
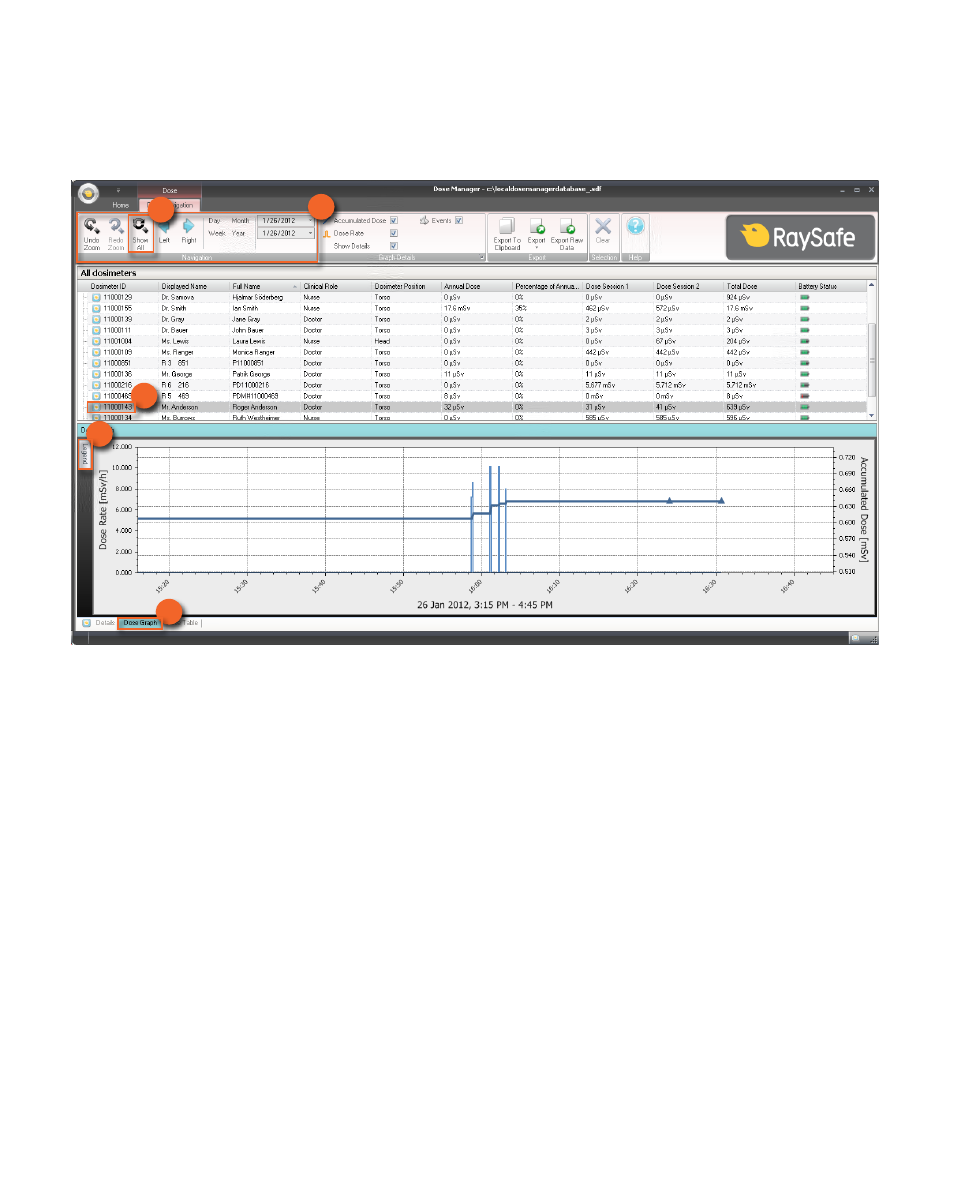
AnAlyZe doSe HIStoRy fRom one doSImeteR
VIew doSe HIStoRy AS A GRAPH
1
5
2
3
4
Figure 24. View dose history as a graph
follow the instructions below to view dose history as a graph:
1. Select the dosimeter you would like to analyze in the All dosimeters window.
2. Click the tab dose Graph to see the dose data presented as a graph.
3. Click Show all.
All available data for the selected dosimeter will appear. the time range will start the first date the dosimeter
begun to measure dose and stop the last date the dosimeter was synchronized.
4. Use the navigation and Graph details toolbars in the dose navigation toolbar to customize the graph and
navigate in it.
5. Click the button legend to the left of the graph to see the graph legend.
to make the graph legend permanently visible, click the pin in the upper right corner. Click the pin again to hide
the graph legend.