Cs5566 – Cirrus Logic CS5566 User Manual
Page 22
CS5566
22
DS806PP2
5/4/09
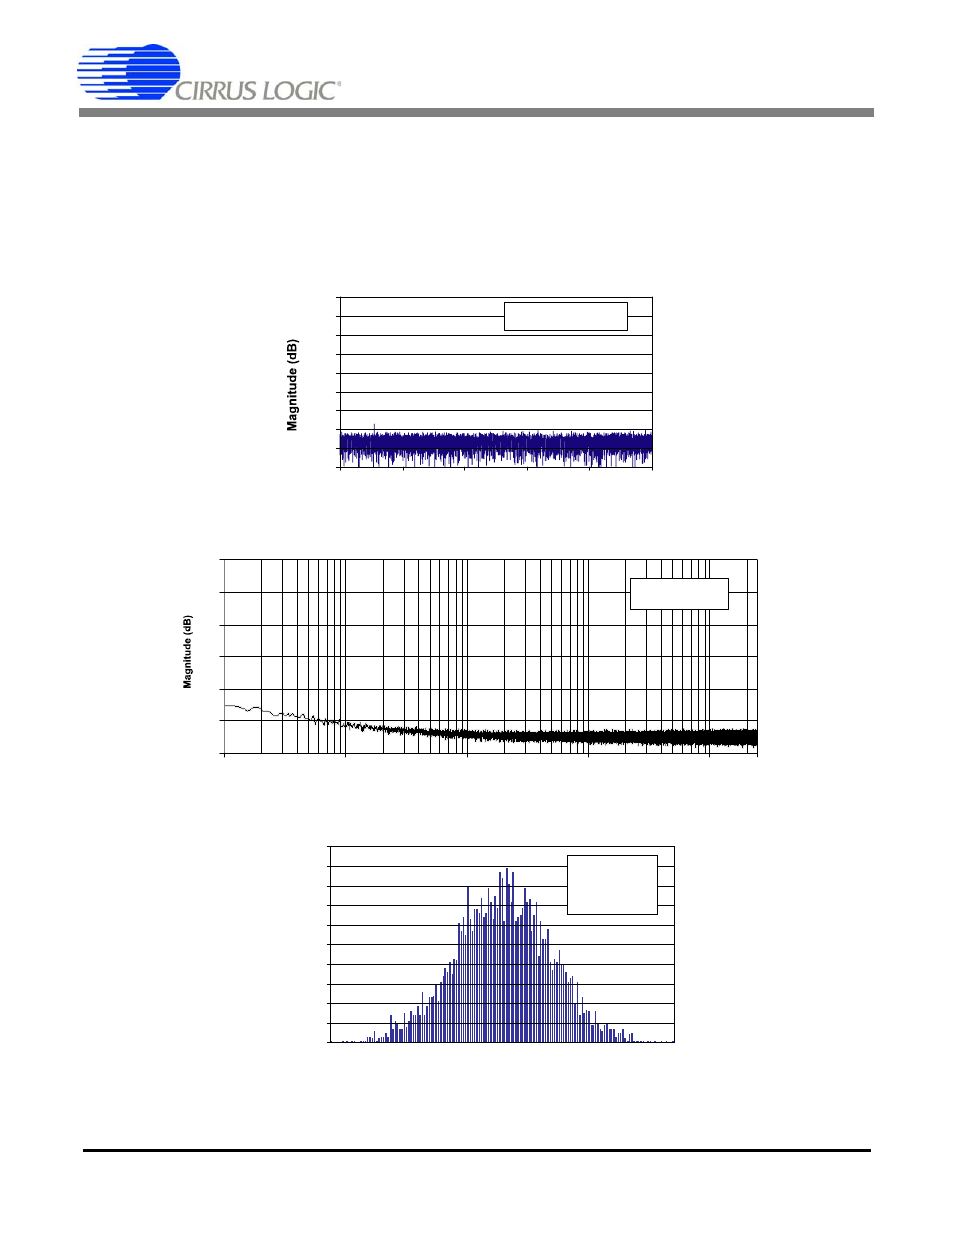
illustrates the device with a small signal 1/1,000,000 of full scale. The signal input for
is about 8.2 microvolts peak to peak, or about 17 codes peak to peak.
illustrates the converter
with a signal at about 2.6 microvolts peak to peak, or about 5 codes peak to peak. The CS5566 achieves
superb performance with this small signal.
illustrates the noise floor of the converter from 0.1 Hz to 2.5 kHz. The plot is entirely free of spu-
rious frequency content due to digital activity inside the chip.
illustrates a noise histogram of the converter constructed from 4096 samples.
-180
-160
-140
-120
-100
-80
-60
-40
-20
0
0
500
1k
1.5k
2k
2.5k
Frequency (Hz)
277 Hz, -130 dB
32k Samples @ 5 kSps
0
10
20
30
40
50
60
70
80
90
100
4096 Samples
Mean = 96.32
Std. Dev. = 21.3
Max - Min = 150
Output Codes
Number
of
Occurances
-180
-160
-140
-120
-100
-80
-60
0.1
1
10
100
1k
2.5k
Frequency (Hz)
Shorted Input
2M Samples @ 5 kSps
16 Averages
Figure 17. Spectral Performance, -130 dB
Figure 19. Noise Histogram (4096 Samples)
Figure 18. Spectral Plot of Noise with Shorted Input