Ethernet statistics, Menu, Navigating the statistics graphs menus – Allied Telesis AT-S21 User Manual
Page 59: Figure 44 graph of received frames, switch level, Ethernet statistics -5, Navigating the statistics graphs menus -5, Wkhuqhw#6wdwlvwlfv
$70654#8VHU·V#*XLGH
4-5
(WKHUQHW#6WDWLVWLFV
Menu:
Ethernet Statistics
You can view statistics on received and transmitted frames in two
ways:
❑
At the switch level, where you see the total of each frame type
on all ports taken together; or
❑
At the port level, further broken down into:
— Per port, all frame types
— Per frame type, all ports taken together
Statistics are a tool for diagnosing a problem and isolating it to a
specific port. You can view graphs that show information on the
switch as a whole. From this total picture, you have the option to
view statistics on a per-frame type or a per-port basis.
1DYLJDWLQJ#WKH
6WDWLVWLFV#*UDSKV
0HQXV
Displaying various statistics graphs does not require you to go
through a hierarchy of menus. Within a particular graph, you can
select to view statistics on a frame type, a port, or the entire system.
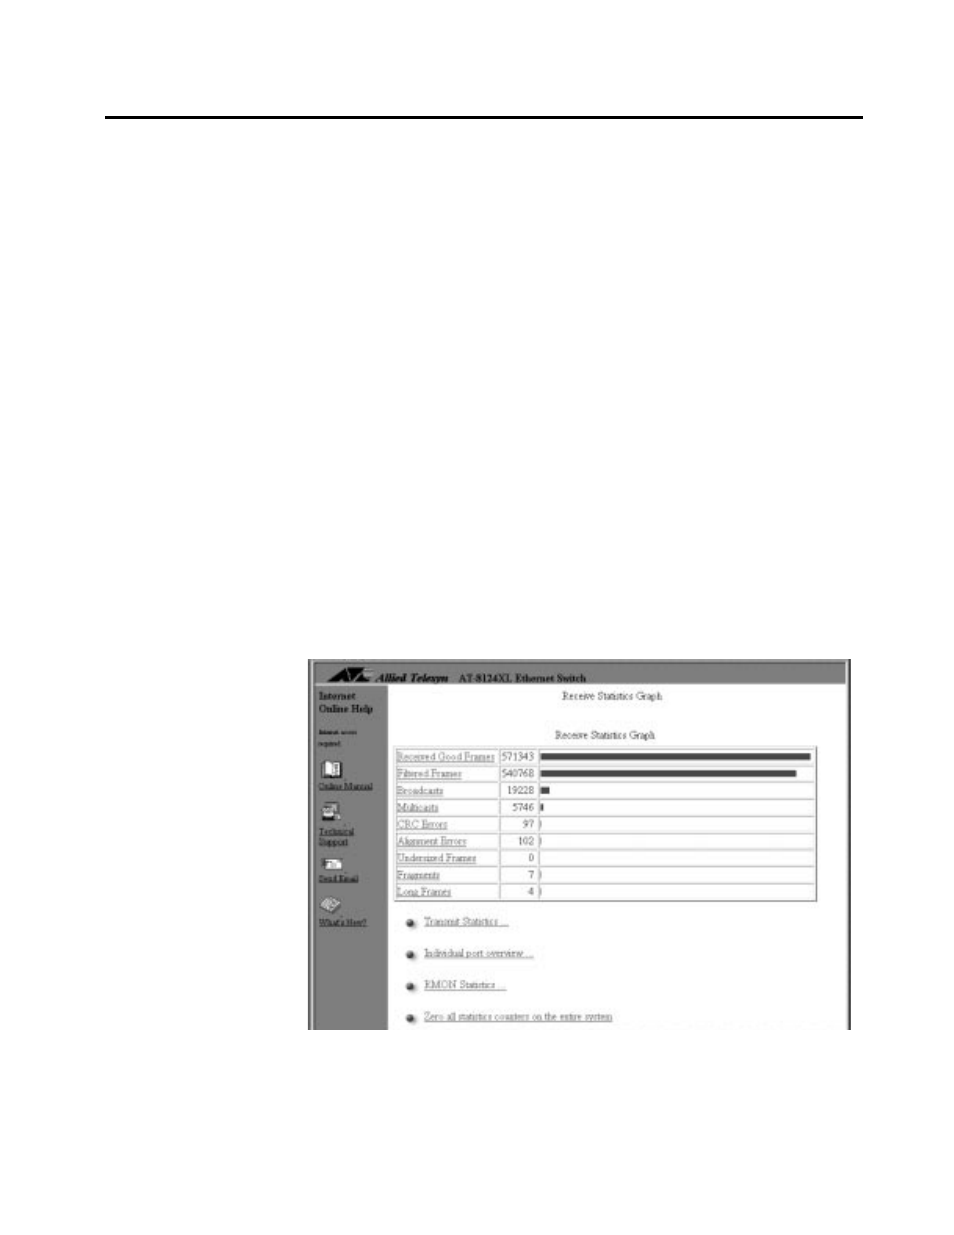
To illustrate, refer to Figure 4-4; it is the first graph Omega displays
when you select Ethernet Statistics from the main menu.
Figure 4-4 Graph of Received Frames, Switch Level