A.2 vapor pressure deficit of the air – Campbell Scientific VisualWeather Software User Manual
Page 62
Appendix A. Evapotranspiration, Vapor Pressure Deficit, and Crop Water Needs
The 24 hourly values of ET
o
calculated using equation (2) are added to
derive an ET
o
(mm/day) value for a day. This process is repeated 7 times
for weekly reports and 30 times for a monthly report.
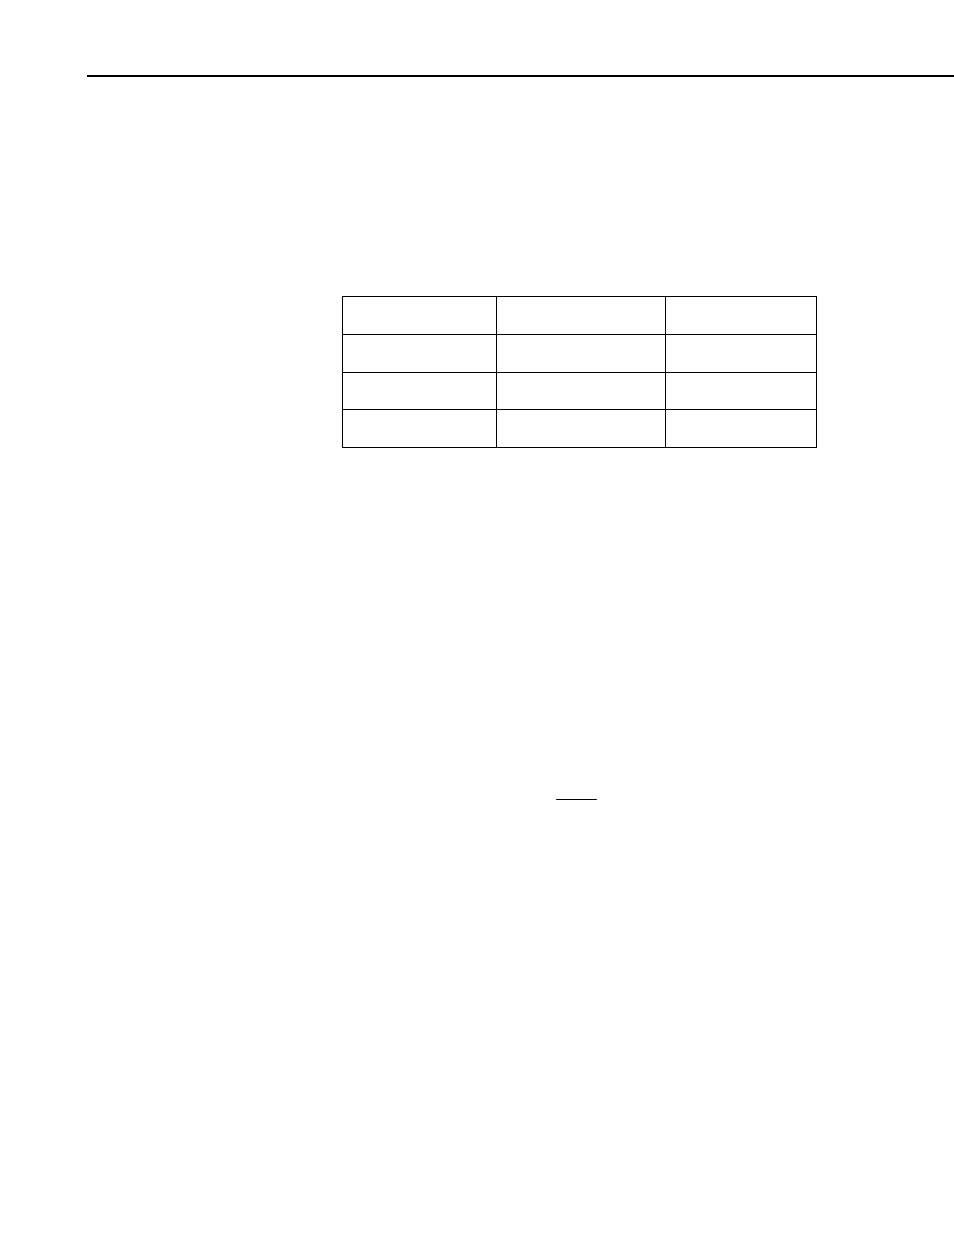
7. Cn, Cd constants
The value of C
n
and C
d
are dependent upon the ET
o
method used and
whether it is day or night. The following table shows the values used for
each method and time of day.
Method Day
Night
ET
O
Short
C
n
= 37, C
d
= 0.24
C
n
= 37, C
d
= 0.96
ET
O
Tall
C
n
= 66, C
d
= 0.25
C
n
= 66, C
d
= 1.7
FAO56 C
n
= 37, C
d
= 0.34
C
n
= 37, C
d
= 0.34
Additional
Notes:
1. VisualWeather accesses hourly average values of temperature (T,
°C), relative humidity (RH, fraction), wind speed (u, m/s), and total
hourly solar radiation (Rs, W/m2) from the database.
2. Solar radiation values are stored in W/m
2
but these are multiplied by
a factor of 0.0036 to convert them into MJ/m
2
/hour.
3. Wind speed varies with altitude. Anemometers are either 2 or 3
meters for agronomy, and 10 m above the ground level if the
application is in meteorology. The ET
O
equation requires that wind
speeds be specified at a standard height of 2 meters. The following
equation is applied to determine wind speed at 2 m height, regardless
of the anemometer position above the ground level.
u2 = u
(4.87)
D
*
(21)
Where, u2= wind speed at standard 2 meter height
D = ln (67.8*Ht -5.42)
Ht= Height is the height of anemometer above the ground level
(meters)
If Ht = 2 meters then u2 = u
A.2 Vapor Pressure Deficit of the Air
The vapor pressure deficit (kPa) of the air is the difference between the value
of saturated vapor pressure (maximum vapor it can accommodate at a given
temperature without condensation) and the actual vapor pressure (the amount
of vapor it holds at the time).
A-8