8 custom gdd reports – Campbell Scientific VisualWeather Software User Manual
Page 30
VisualWeather
™
Software
right-clicking and choosing Delete. Selecting the Generate daily values if
time range > 1 day will cause only daily values to be monitored if the time
range for the report is greater than two weeks.
Press the Delete This Report button to delete this custom X-Y report.
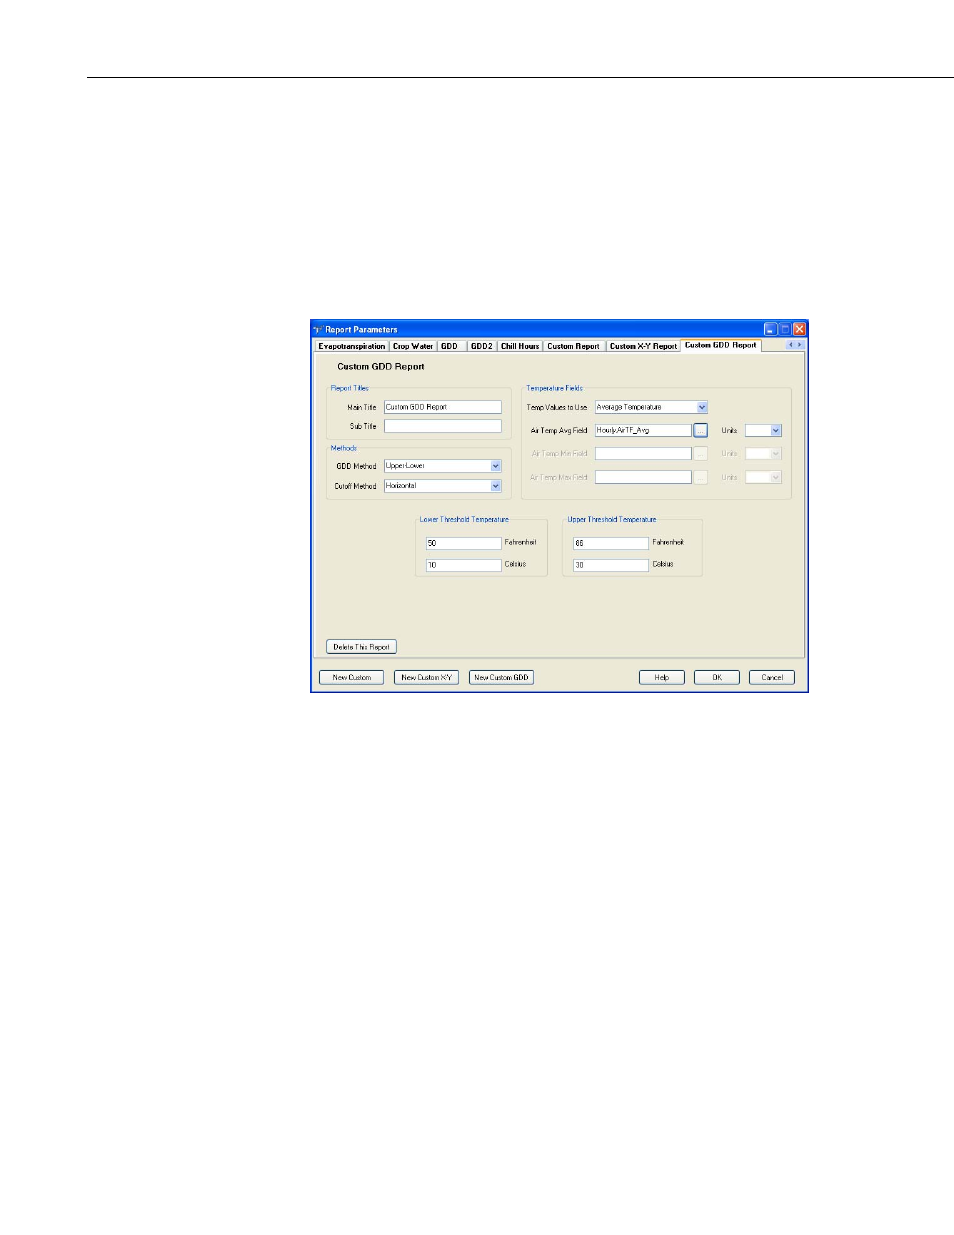
7.2.8 Custom GDD Reports
Custom GDD report are available that are similar to the GDD and GDD2
reports, but allow the user to choose the algorithm used to calculate the GDD.
The Main Title and Sub Title fields are used to provide headings for the
report.
The method used to calculate the GDD is determined by what is selected in
GDD Method. The Cutoff Method, Temperature Fields, Lower (Base)
Temperature, and Upper Temperature Limit also affect the calculation as
explained below as they relate to each GDD Method.
• Simple (single base temperature) – Compares mean temperature
(Tmean) to a Lower (Base) Temperature (Tbase). The Tmean value
used is based on the Temp Values to Use field. If Average Temperature
is selected, Tmean equals the Air Temp Avg Field. If Min/Max
Temperature is chosen, Tmean = (Air Temp Max Field – Air Temp Min
Field)/2. The GDD is calculated as follows:
If (Tmean > Tbase) then
GDD = (Tmean – Tbase) * dataInterval
Else
GDD
=
0
20