Calculations – Campbell Scientific CR5000 Measurement and Control Module User Manual
Page 124
Section 6. Data Table Declarations and Output Processing Instructions
6-30
Calculations:
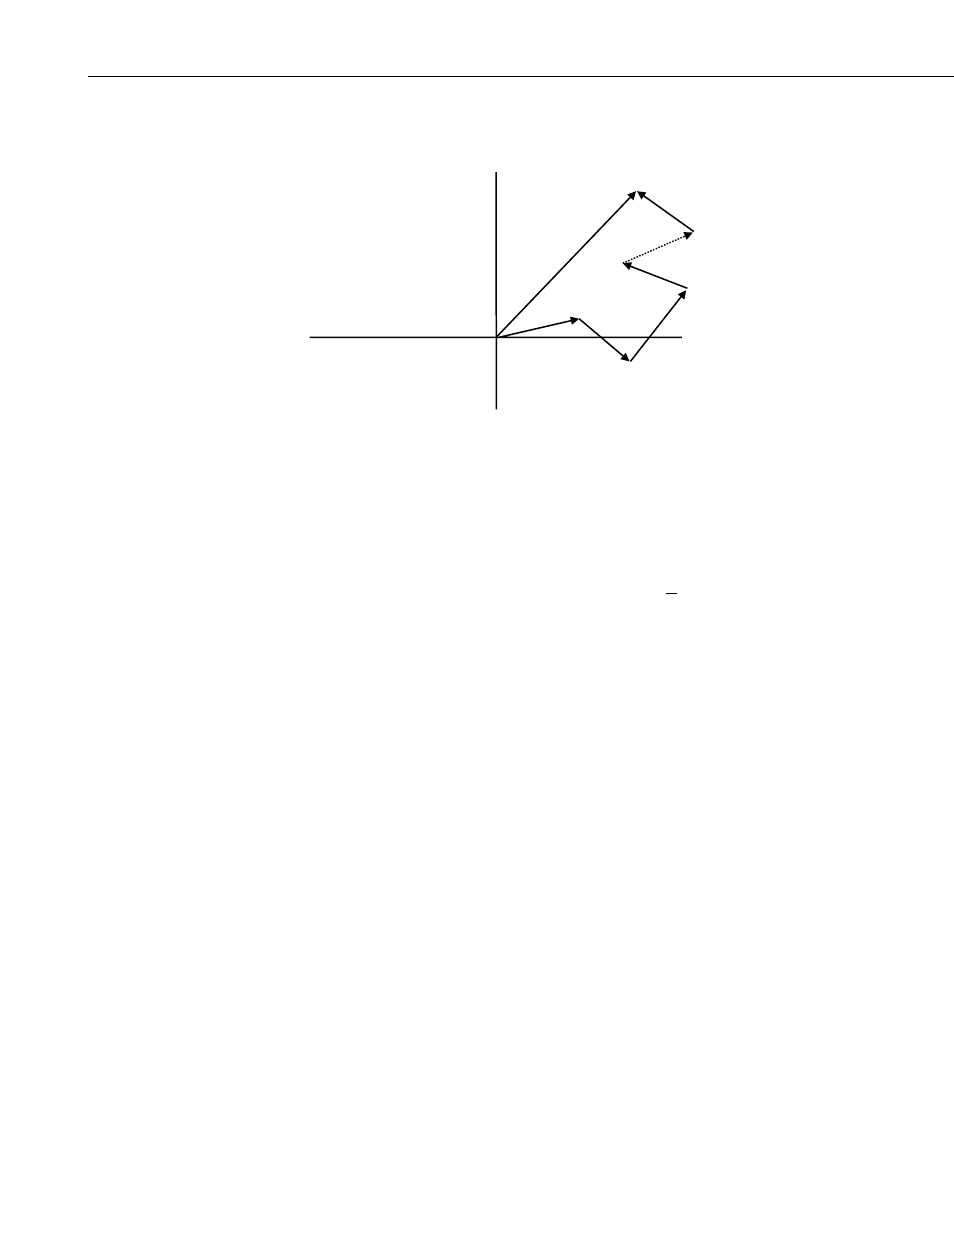
FIGURE 6.4-2. Input Sample Vectors
In Figure 6.4-2, the short, head-to-tail vectors are the input sample vectors
described by
s
i
and
Θ
i
, the sample speed and direction, or by Ue
i
and Un
i
, the
east and north components of the sample vector. At the end of output interval
T, the sum of the sample vectors is described by a vector of magnitude U and
direction
Θ
u. If the input sample interval is t, the number of samples in output
interval
T
is N
T t
=
/ . The mean vector magnitude is
U
U
N
=
/
.
Scalar mean horizontal wind speed, S:
S=(
Σ
s
i
)/N
where in the case of orthogonal sensors:
S
i
=(Ue
i
2
+Uni
2
)
1/2
Unit vector mean wind direction,
Θ
1:
Θ
1=Arctan (Ux/Uy)
where
Ux=(
Σ
sin
Θ
i
)/N
Uy=(
Σ
cos
Θ
i
)/N
or, in the case of orthogonal sensors
Ux=(
Σ
(Ue
i
/U
i
))/N
Uy=(
Σ
(Un
i
/U
i
))/N
where U
i
=(Ue
i
2
+Un
i
2
)
1/2
Standard deviation of wind direction,
σσσσ
(
Θ
Θ
Θ
Θ
1), using Yamartino algorithm:
σ
(
Θ
1)=arc sin(
ε
)[1+0.1547
ε
3
]
where,
ε
=[1-((Ux)
2
+(Uy)
2
)]
1/2
and Ux and Uy are as defined above.
s
n
Θ
u
s
2
North
East
U
s
1
s
3
s
4
- 014A Met One Wind Speed Sensor (36 pages)
- 020C Wind Direction Sensor (26 pages)
- 024A-L Met One Wind Direction Sensor (30 pages)
- 03001-L R.M. Young Wind Sentry Set (34 pages)
- 03002, 03101, and 03301 R. M. Young Wind Sentry Sensors (40 pages)
- 034A-L WindSet (16 pages)
- 034B-L Met One Windset (34 pages)
- 036, 038 Spark Gapped Junction Box (6 pages)
- 05103, 05103-45, 05106, and 05305 R. M. Young Wind Monitors (30 pages)
- 083E Relative Humidity and Temperature Sensor (22 pages)
- 0871LH1 Freezing Rain Sensor (31 pages)
- 092 Barometric Pressure Sensor (24 pages)
- 10164-L Water Sampler Control Cable for use with Isco and Sigma Autosamplers (18 pages)
- 107-L Temperature Probe (28 pages)
- 108-LC Temperature Probe for MetData1 (12 pages)
- 108-L Temperature Probe (30 pages)
- 109-L Temperature Probe (30 pages)
- 109SS Temperature Probe (32 pages)
- 110PV Surface Temperature Probe (32 pages)
- 21108 RF450 Demo Kit (14 pages)
- 223-L Delmhorst Cylindrical Soil Moisture Block (28 pages)
- 227-L Delmhorst Cylindrical Soil Moisture Block (24 pages)
- 229 Water Matric Potential Sensor and CE4/CE8 (34 pages)
- 237-L Leaf Wetness Sensor (14 pages)
- 247-L Conductivity and Temperature (18 pages)
- 253-L and 257-L (Watermark 200) Soil Matric Potential Sensors (36 pages)
- 25458 DIN-Rail Terminal Kit (10 pages)
- 255-100 Novalynx Analog Output Evaporation Gauge (16 pages)
- 260-953 Alter-Type Wind Screen for Tipping Bucket Rain Gages (14 pages)
- 27106T Gill Propeller Anemometer (18 pages)
- 30066 Battery Terminal Bus (1 page)
- 380, 385, 380M, 385M Met One Rain Gages (22 pages)
- 3WHB10K 3-Wire Half-Bridge Terminal Input Module (14 pages)
- 43347 RTD Temperature Probe and 43502 Aspirated Radiation Shield (40 pages)
- 4386 Battery Terminal Bus (1 page)
- 4WFB120, 4WFB350, 4WFB1K 4-Wire Full Bridge Terminal Input Module (22 pages)
- 4WFBS120, 4WFBS350, 4WFBS1K 4 Wire Full Bridge Terminal Input Modules (46 pages)
- 4WPB100, 4WPB1K PRT Terminal Input Modules (16 pages)
- 52202 Electrically Heated Rain and Snow Gage (16 pages)
- 9522B Iridium Satellite Modem and COM9522B Interface Modem (46 pages)
- A100LK Anemometer (18 pages)
- A150 Desiccated Case (12 pages)
- A21REL-12 Relay Driver (10 pages)
- A6REL-12 Relay Driver (12 pages)
- AL200 ALERT2 Encoder, Modulator, and Sensor Interface (44 pages)