Campbell Scientific CR5000 Measurement and Control Module User Manual
Page 119
Section 6. Data Table Declarations and Output Processing Instructions
6-25
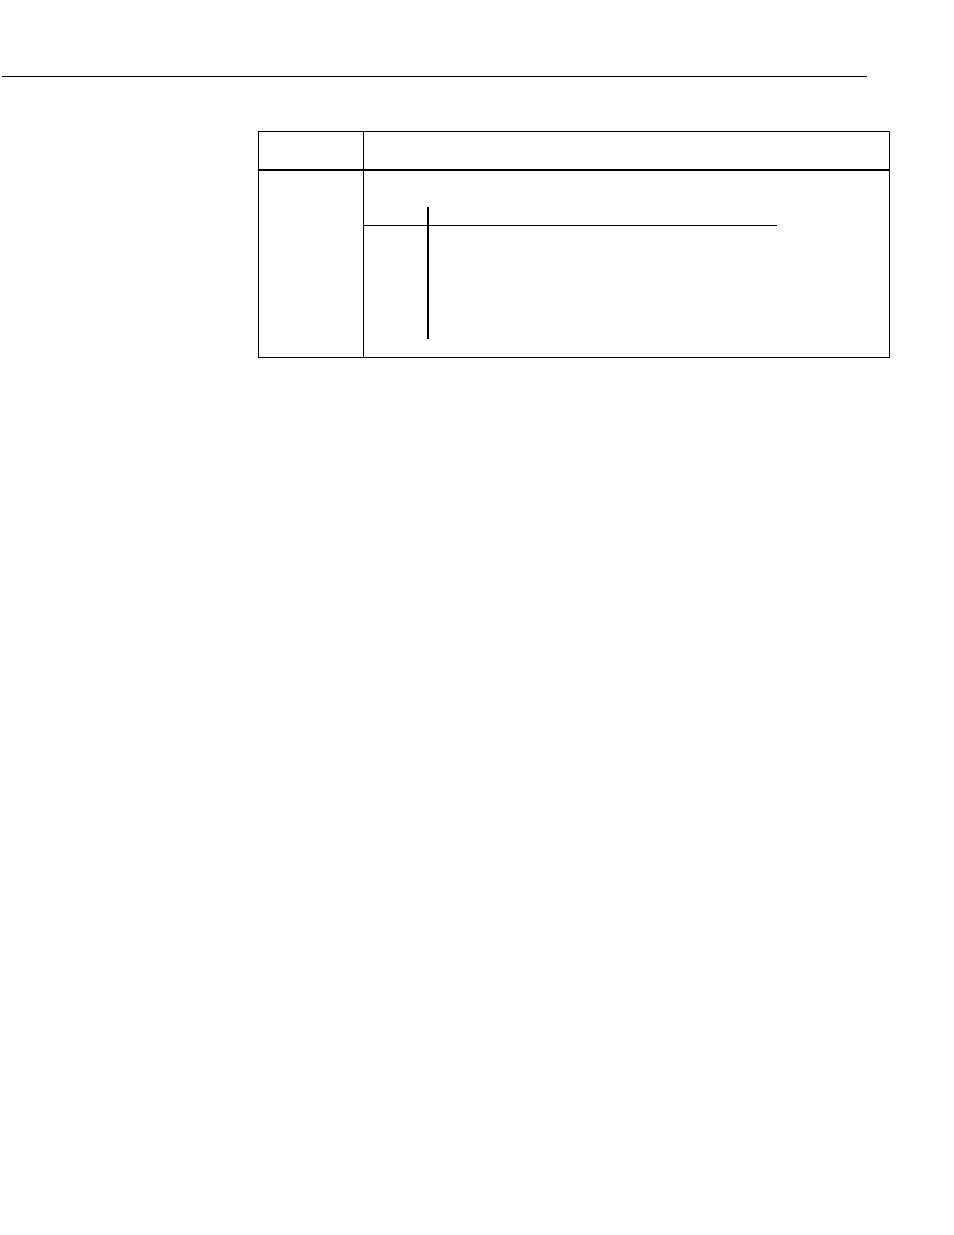
Parameter
& Data Type
Enter
Form
Constant
The Form code is 3 digits - ABC
Code
Form
A = 0
Reset histogram after each output.
A = 1
Do not reset histogram.
B = 0
Divide bins by total count.
B = 1
Output total in each bin.
C = 0
Open form. Include outside range values in end bins.
C = 1
Closed form. Exclude values outside range.
101 means: Do not reset. Divide bins by total count. Closed form.
Processes data with the rainflow counting algorithm, essential to estimating
cumulative damage fatigue to components undergoing stress/strain cycles.
Data can be provided by making measurements in either the standard or the
burst mode. The Rainflow Instruction can process either a swath of data
following the burst mode, or it can process "on line" similar to other processing
instructions.
The output is a two dimensional Rainflow Histogram. One dimension is the
amplitude of the closed loop cycle (i.e., the distance between peak and valley);
the other dimension is the mean of the cycle (i.e., [peak value + valley
value]/2). The value of each element (bin) of the histogram can be either the
actual number of closed loop cycles that had the amplitude and average value
associated with that bin or the fraction of the total number of cycles counted
that were associated with that bin (i.e., number of cycles in bin divided by total
number of cycles counted).
The user enters the number of mean bins, the number of amplitude bins, and
the upper and lower limits of the input data.
The values for the amplitude bins are determined by the difference between the
upper and lower limits on the input data and by the number of bins. For
example, if the lower limit is 100 and the upper limit is 150, and there are 5
amplitude bins, the maximum amplitude is 150 - 100 = 50. The amplitude
change between bins and the upper limit of the smallest amplitude bin is 50/5 =
10. Cycles with an amplitude, A, less than 10 will be counted in the first bin.
The second bin is for 10
≤
A < 20, the third for 20
≤
A < 30, etc.
In determining the ranges for mean bins, the actual values of the limits are used
as well as the difference between them. The lower limit of the input data is
also the lower limit of the first mean bin. Assume again that the lower limit is
100, the upper limit 150, and that there are 5 mean bins. In this case the first
bin is for cycles which have a mean value M, 100
≤
M < 110, the second bin
110
≤
M < 120, etc.
If C
m,a
is the count for mean range m and amplitude range a, and M and N are
the number of mean and amplitude bins respectively, then the output of one
repetition is arranged sequentially as (C
1,1
, C
1,2
, ... C
1,N
, C
2,1
, C
2,2
, ... C
M,N
).
Multiple repetitions are sequential in memory. Shown in two dimensions, the
output is: