DAVIS Vantage Pro Quick Reference Guide User Manual
Page 3
HUM
DEW PT
Press HUM to toggle between:
•
Outside Humidity (%)
•
Inside Humidity (%)
•
Hum 2–8 (%) if you have a Temperature/Humidity Station.
•
Leaf Wetness & Outside Temperature (0
°
F, 0.0
°
F, 0
°
C, 0.0
°
C ) if you
have a Leaf Wetness Station. Continue to press HUM to display
each leaf wetness/temperature pair. Maximum is four pairs.
Press 2
ND
& DEW PT
to display:
•
Dew Point (
°
F,
°
C)
Press 2
ND
& UNITS
to change unit of measure.
All temperature-related readings (inside and outside temperature, wind
chill, heat index, and dew point) will read in the same unit of measure.
Changing one from
°
F to
°
C (or vice versa) changes all others.
20
13
HEAT
ET
Press 2
ND
& HEAT
to toggle between:
•
Heat Index (
°
F,
°
C)
•
THSW (Temp-Hum-Wind-Sun) Index (
°
F,
°
C) if you have solar radia-
tion sensor.
Press 2
ND
& UNITS
to change unit of measure.
All temperature-related readings (inside and outside temperature, wind
chill, heat index, and dew point) will read in the same unit of measure.
Changing one from
°
F to
°
C (or vice versa) changes all others.
On the ticker tape:
HEAT INDEX WARNING . . . will appear on the ticker tape when you
are displaying heat index if the reading is >=90
°
F (32
°
C).
If you have a solar radiation sensor, press 2
ND
& ET to
toggle between:
•
ET Day (0.00 in, 0.0 mm)
•
ET Month (0.00 in, 0.0 mm)
•
ET Year (0.00 in, 0.0 mm)
Press 2
ND
& UNITS
to change unit of measure.
All rain and ET readings will read in the same unit of measure. Chang-
ing one from 0.00 inches to 0.0 mm (or vice versa) changes all others.
Update interval:
ET is updated once an hour, on the hour.
18
15
FORECAST
GRAPH
Update Interval:
The forecast is updated once an hour, on the hour.
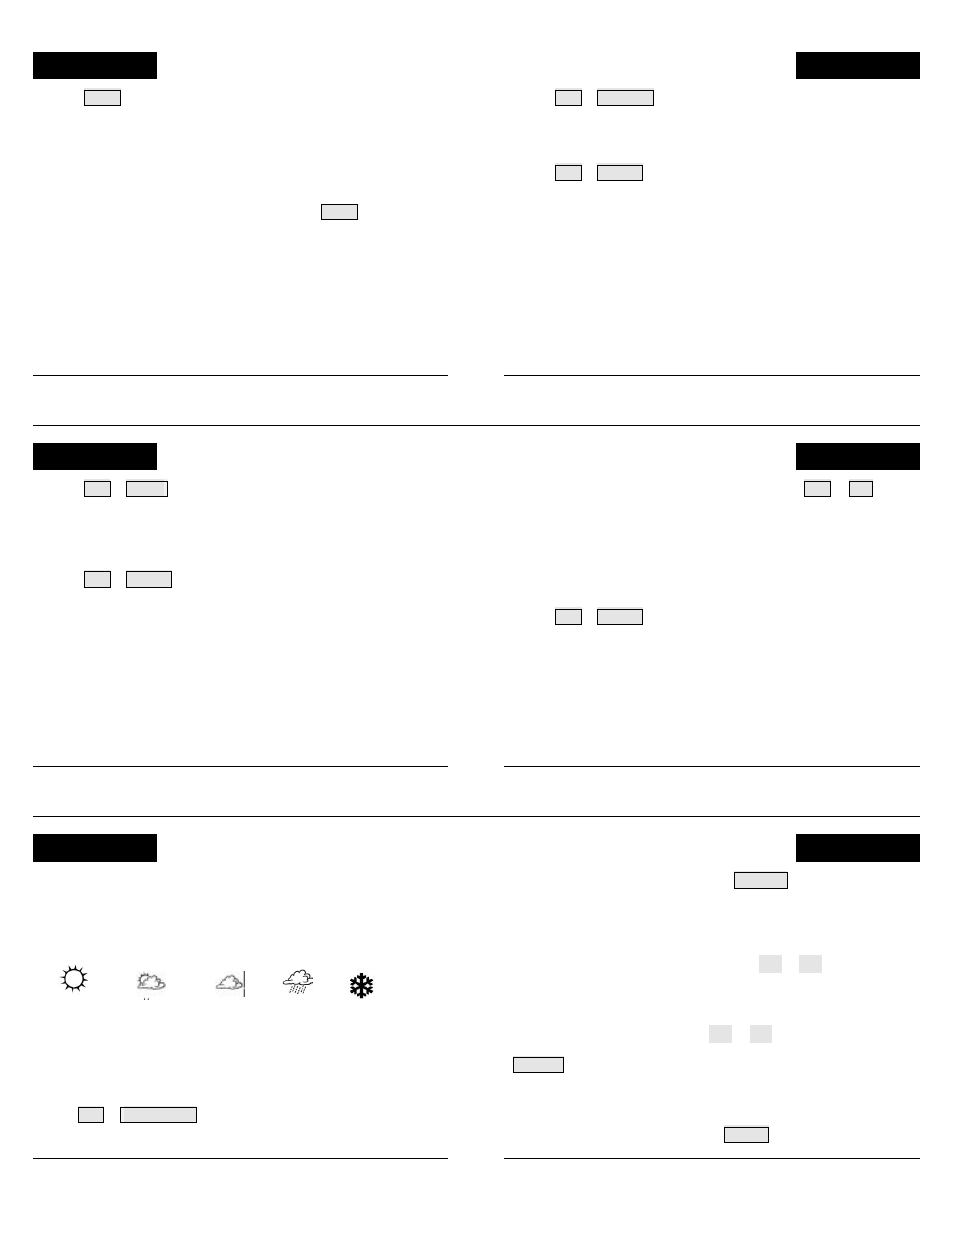
Forecast Icons:
The forecast icons predict the weather within the next twelve hours.
Mostly Partly Mostly Rain Snow
Clear Cloudy Cloudy Likely
If rain or snow is possible (but less certain than "likely"), you will see the
partly cloudy icon along with the rain or snow icon.
Ticker Tape:
Press 2
ND
& FORECAST
to view a detailed forecast in ticker tape.
The ticker tape messages predict the weather up to 48 hours ahead.
To enter the graph screen: Press GRAPH . You will see the
graph and the min & max readings for the selected weather variable.
The reading in the weather variable field corresponds to the flashing dot
on the graph. To view another weather variable, press the key(s) for
that variable.
To view a selected data point: Press ( < ) or ( > ) to move right or
left on the graph. The selected data point will flash, and the reading in
the weather variable field will change. The time and/or date will also
change as you move back and forward on the graph.
To graph highs & lows: Press ( + ) or ( −− ) to change the graph to
the highs and lows for the last 24 days, months, or years. Press
HI/LOW to switch between highs and lows. The time and date will
change as you move back and forward in time. (NOTE: Not all highs
and lows are available for all weather variables. See Console Manual
for details.)
To exit the graph screen: Press DONE .
16
17